
Thank you to everyone who entered the #IronQuest ‘Sporting Heroes and Legends’ round, in collaboration with #SportsVizSunday. At the time of writing, we’ve received 29 entries! The wrap-up blog post featuring all of the entries will be published soon. In the meantime, we have a brand-new #IronQuest challenge for you!
This month I asked my Twitter followers to suggest topics for #IronQuest. We received an incredible response with a broad range of suggestions. I took the top four suggestions (based on the number of likes) and asked people to vote for their favourite. Here are the results:

With 45.5% of the vote, we have a winner! Thank you to everyone who voted. The other suggestions will be added to our topic idea backlog and will most likely be featured in a future challenge!
The Theme
I’m excited to announce this months’ #IronQuest theme is ‘Viz a Year or Decade’. Originally the theme was going to be ‘viz the year or decade you were born’. However, we recognise that some people may be sensitive about sharing their age so instead, we’re letting you pick a year or decade of your choice.
If you need some inspiration to help you decide what to viz, keep reading. Below I’ve collected some vizzes from the community which fit the theme to inspire you. To be honest, I struggled to find many examples that fit this theme perfectly so I can’t wait to see what you all come up with!
Click on any of the vizzes to view them in full on Tableau Public.
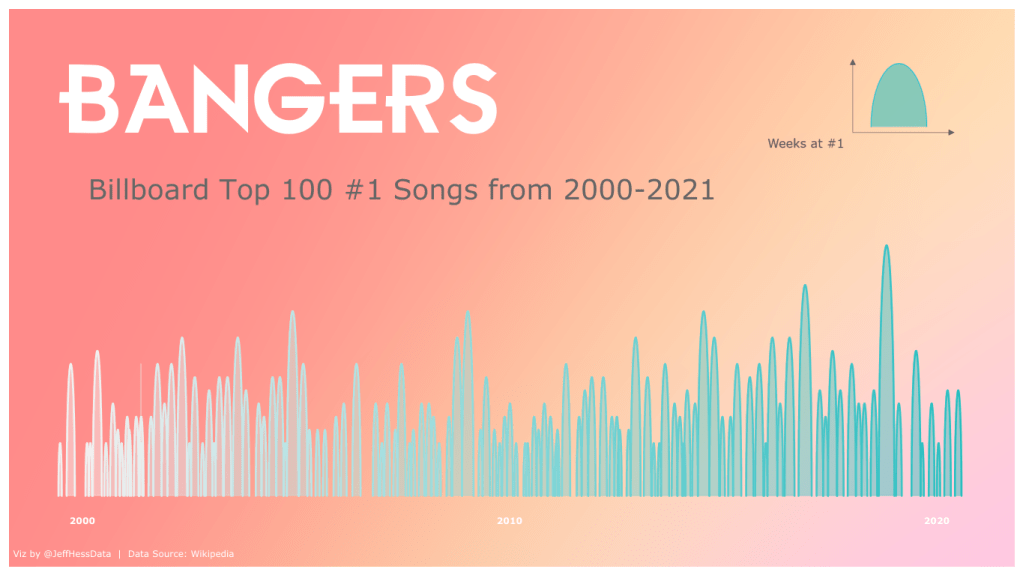
First up is this viz by Jeffrey Hess which explores the Billboard Top 100 #1 Songs from 2000-2021:
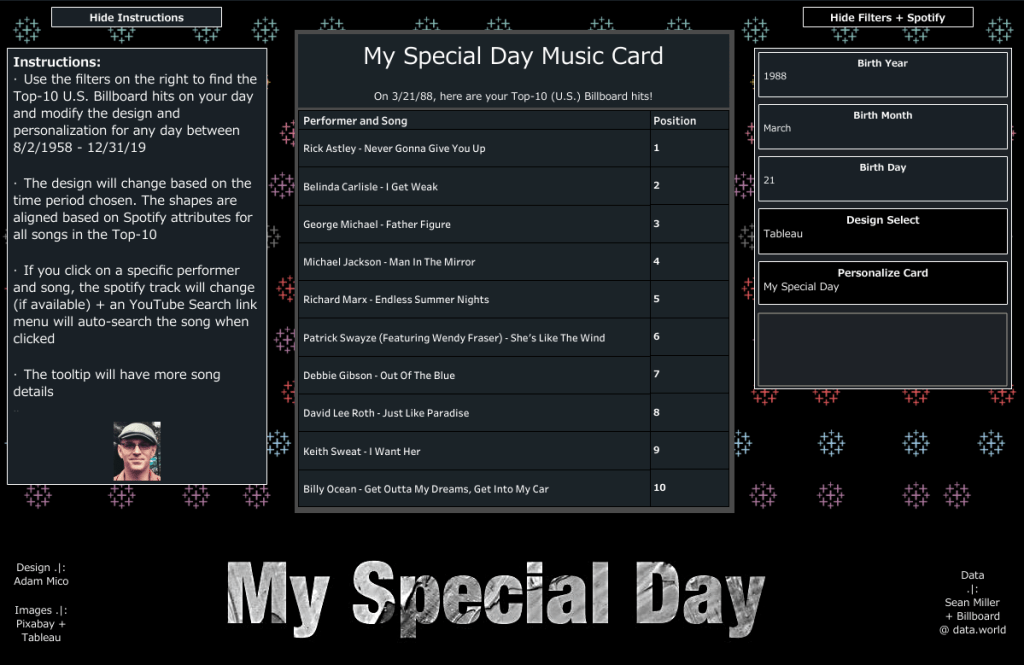
Next up is a viz by Adam Mico. In this viz, Adam has set up a dashboard for users to enter their birthday (or any date in the given range) and the viz will show the Top 10 U.S. Billboard hits on the chosen date:
Another viz which focuses on the music of a particular decade is this abstract viz by Neil Richards. Here, Neil has used an Eighties-inspired design to visually encode the number one hits of the decade:

Finally, we have a movie viz by Kimley Scott. In this example, Kimley explores movie ratings each year for movies released between 2010 and 2019:

While these examples focus on music and movies, your entry can cover anything related to your chosen year or decade. Some ideas to get you started include:
- Notable events
- Most popular things
- New or notable things
- General themes or trends
- Something special to you
How do I enter?
The process is simple:
- Source your data and build a viz that somehow touches upon the chosen theme for the month.
- Upload your viz to Tableau Public or somewhere where it can be openly viewed online.
- Fill in the submissions tracker (embedded at the bottom of this post) so we can keep track of who is participating. This step is essential if you want to request feedback or be credited in the wrap-up blog post.
- If you opted in for feedback in step 3, the co-hosts and I will provide some constructive feedback on your viz after the submission period closes.
Top Tips
- You can use any data set which fits the theme (assuming you have permission to share it publicly).
- Always remember to credit your data source/s on your viz.
- Refrain from using any images or logos on your viz unless you have permission to do so.
- Remember the Iron Viz judging criteria and try to focus on all three; Design, Storytelling and Analysis.
- Think outside the box!
Meet the Co-host
I’m very excited to announce that I’ll be teaming up with Judit Bekker this month! Judit suggested the topic this month and I’ve wanted to team up with her on #IronQuest for some time.

Judit Bekker is a Data Visualization Designer from Budapest who loves beautiful things. She believes even small data can have a big impact, that people can only grow by elevating others, and that you don’t need to be the best in everything to be the best in something. Judit is obsessed with arts and design, fonts, books, movies, cycling, plants, food, and so much more. It’s safe to say there is more she’s passionate about than she isn’t.
Judit has an extensive Tableau Public portfolio filled with beautiful, insightful vizzes. I highly recommend checking it out!
When is the submission deadline?
The deadline for submissions is midnight PST on Sunday, 19th December. Please use the submissions form below to submit your entry.
Feedback will be provided (to those who request it) via a conversation recorded and posted to YouTube between Judit and me, shortly after the deadline date. On the submissions form you can specify if you require feedback focused on the Iron Viz scoring criteria (design, storytelling and analysis) or more general data viz feedback.
Please note, if we receive a large number of feedback requests (more than we can cover in two hours), we’ll initially prioritise those from Tableau beginners or those entering #IronQuest for the first time. Any remaining feedback will be shared with the authors directly via email.
Continue the conversation and connect with other participants by following the #IronQuest hashtag on Twitter and LinkedIn.
Thanks for reading and we look forward to seeing your entry!
Credits: Header image by Olya Kobruseva from Pexels.
