
As we enter another month of Iron Quest, I first want to congratulate all previous participants who recently entered an Iron Viz feeder for the first time!
Iron Viz is challenging and it’s natural to feel nervous about entering a competition of this scale. Despite this, I know many people ‘took the plunge’ this year which is fantastic. There were an incredible 320 Iron Viz entries for the single global “Data + Joy” feeder this year (compared to 371 entries for the single feeder in 2020). It’s always fascinating for me to see the diversity in approaches to the topic, in addition to the creative application of Tableau Desktop features. It’s also refreshing to see more entries by brand-new authors from different countries around the world. Best of luck to everyone who entered!
If you haven’t already, I would encourage you to explore the Iron Viz gallery to see all of the entries in one place! You’re guaranteed to be inspired.
The Theme
I’m excited to announce this month’s’ #IronQuest theme is ‘Travel & Vacations’. This time of year is typically when many people take a break from work or school and go on a vacation. A vacation could consist of any kind of recreational travel; whether that be a short day trip or a longer holiday, perhaps even visiting another country. Given the restrictions on travel that were in place due to the pandemic, many people haven’t been able to travel as they normally would for some time. Even now, some restrictions on travel remain. With this in mind, I’m sure many people will be dreaming of places they could visit when restrictions are lifted. Or perhaps you’ve been lucky enough to travel somewhere recently. Either way, the ‘Travel & Vacations’ theme will no doubt provide you with lots of travel ideas!
If you are in need of some inspiration to help you decide what to viz, keep reading. Below I’ve collected some vizzes from the community which fit the theme to inspire you. Click on any of the vizzes to view them in full on Tableau Public.
First up is this viz by Kimly Scott, originally entered for the #IronQuest quantified self round last year:
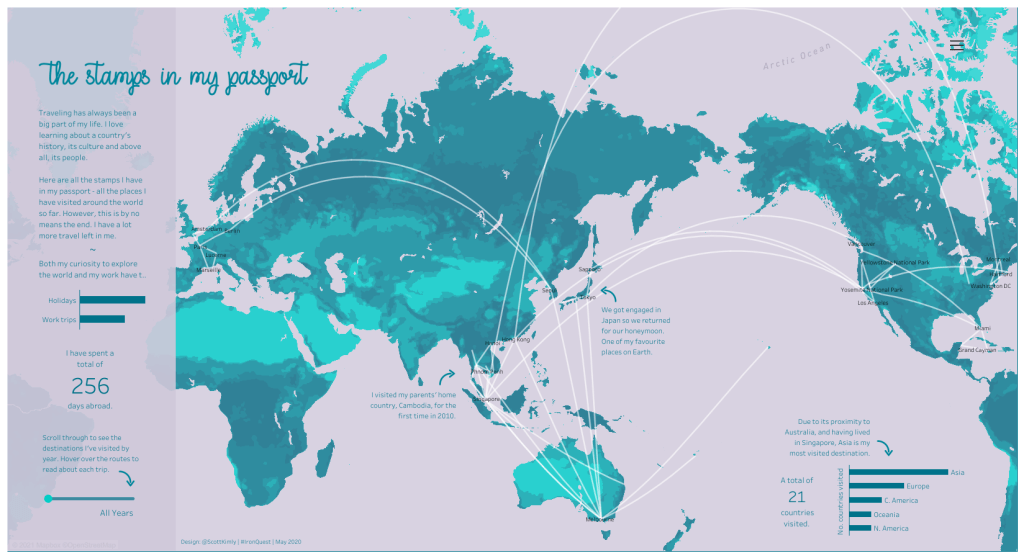
In this viz, Kimly plotted all of the places she has visited around the world so far. It’s a beautiful viz with a wonderful sentiment!
Next up is a viz by Autumn Battani:
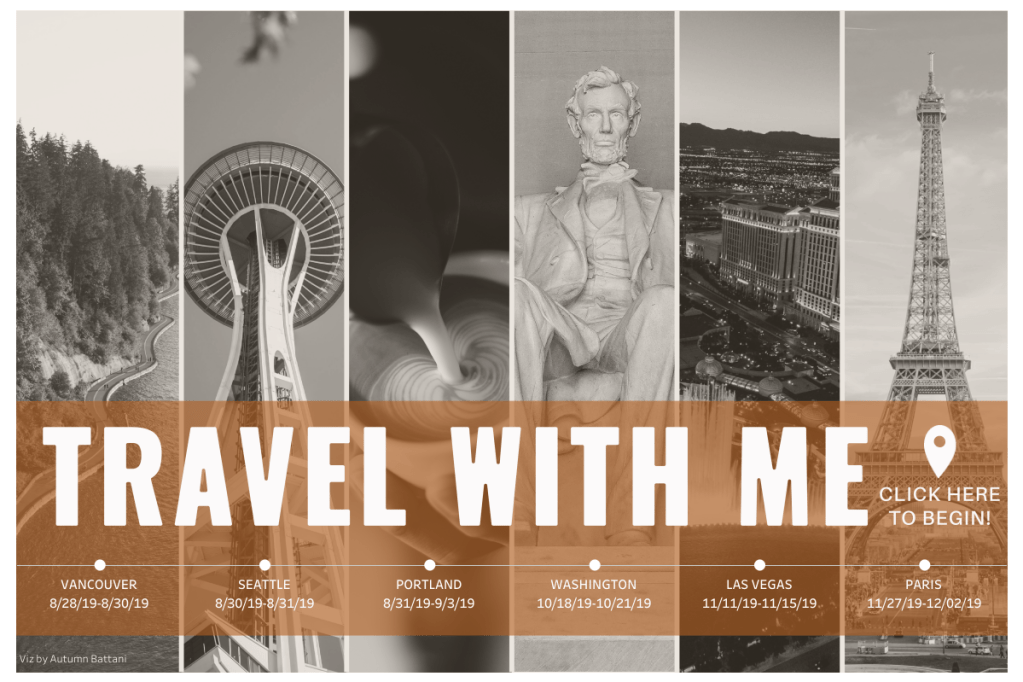
In this viz, Autumn documents here travels around the US in 2019, tracking and visualising data about her activities in each city! This viz certainly gives me the travel bug and gives me some ideas on data I could collect on my next trip.
Here’s another post-trip documentation viz by Wendy Shijia:
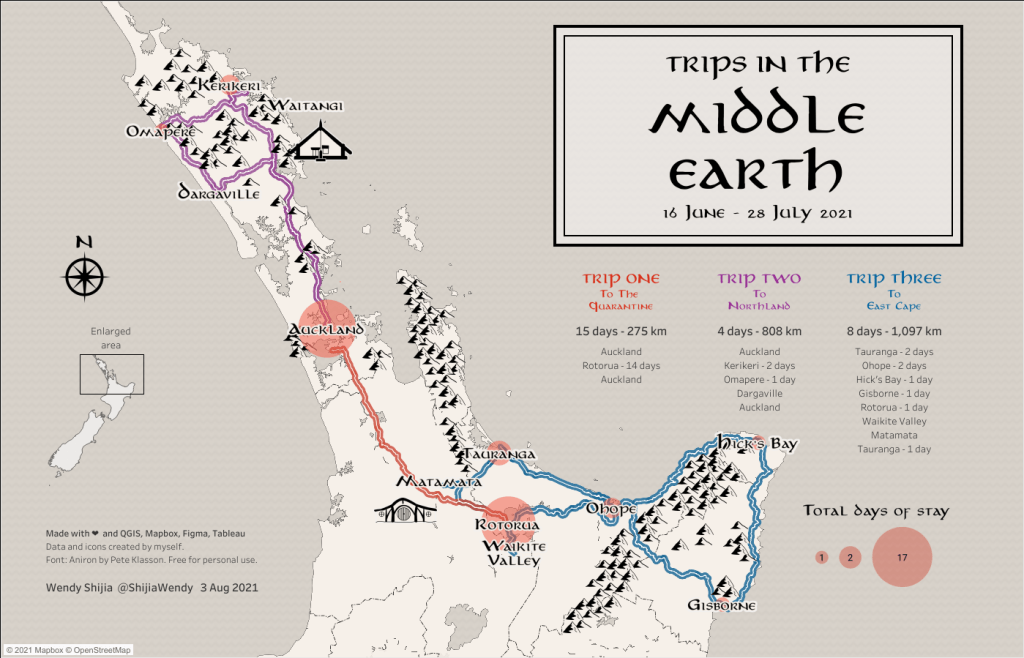
In this viz, Wendy documented her recent trip to New Zealand, mapping the route of where she travelled while she was there.
I’m conscious that many people haven’t been able to travel abroad for some time due to the pandemic so might be a bit ‘light’ on travel data. Nevertheless, that doesn’t stop you from visualising places that you would like to travel to in the future. That’s exactly what I did here for my Iron Viz Europe entry in 2018:
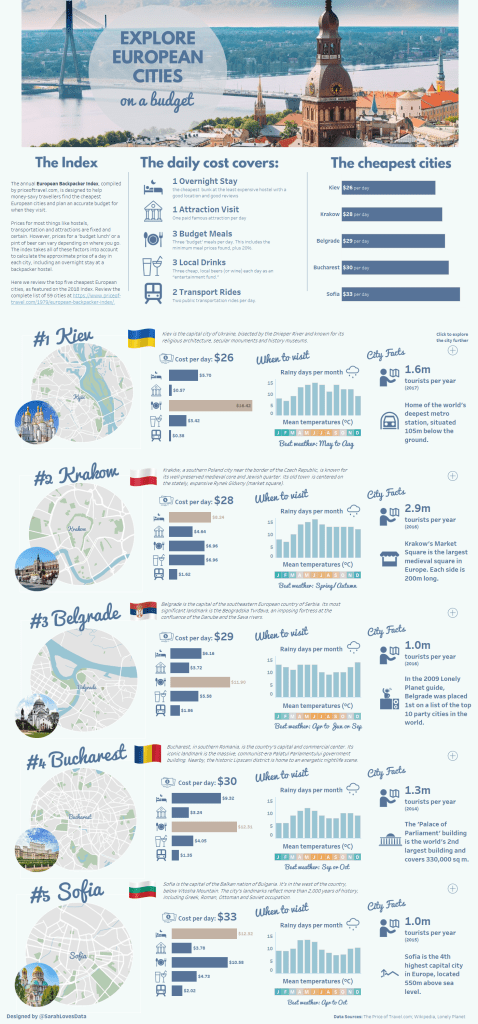
In this viz, I visualised the top 5 cheapest places you could travel to in Europe on a backpackers budget. It was a great way to learn more about places I would like to visit in the future.
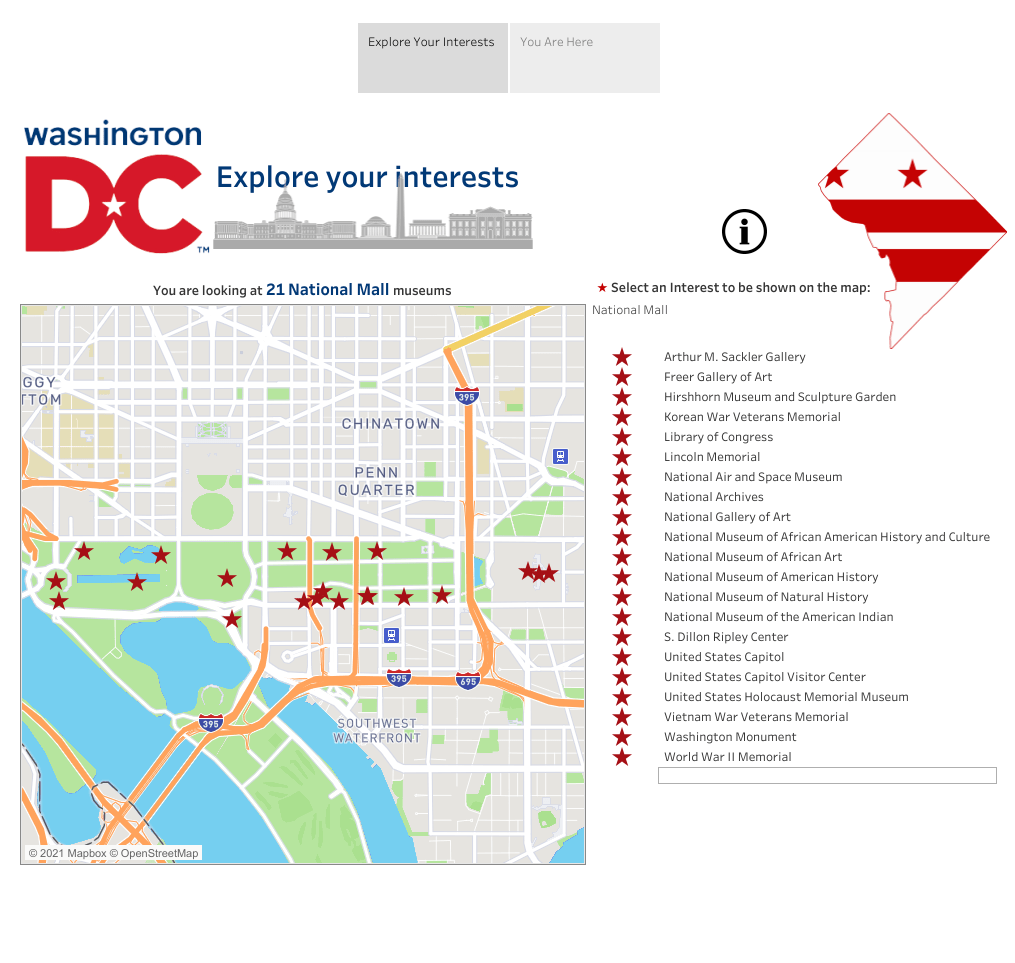
Or perhaps you’ll choose to create a travel guide-style viz, either for yourself or others, to help navigate a new city or holiday destination. That’s exactly what Patrick Sarsfield did here for his viz on museums in Washington D.C:
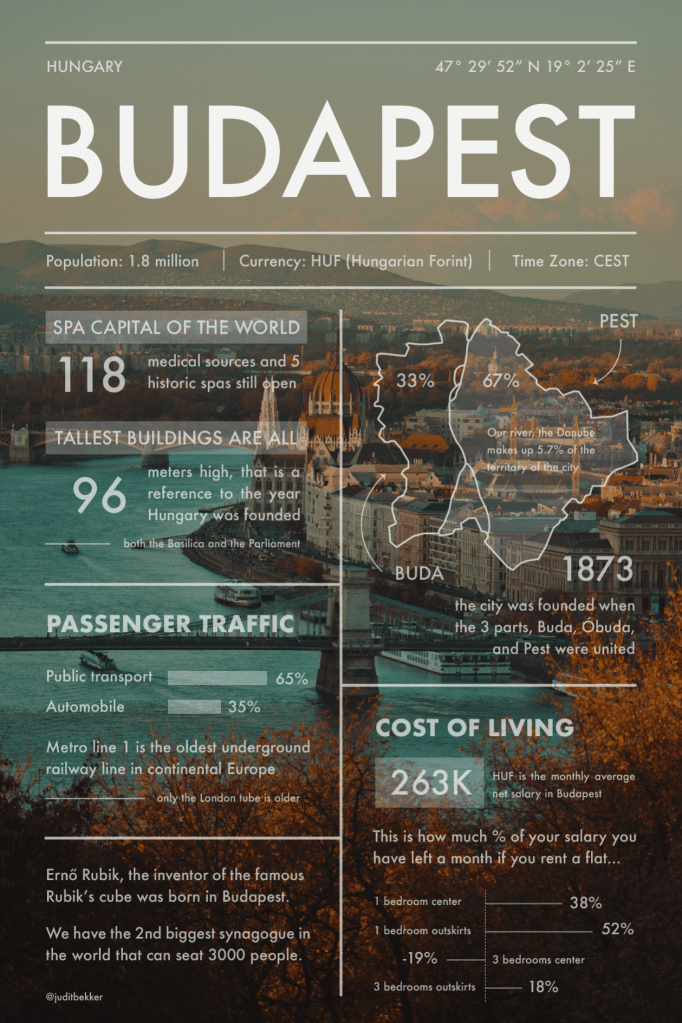
Perhaps you’re lucky enough to live in a place where others visit on vacation. In this viz, Judit Bekker made an infographic-style viz about her home city; Budapest:
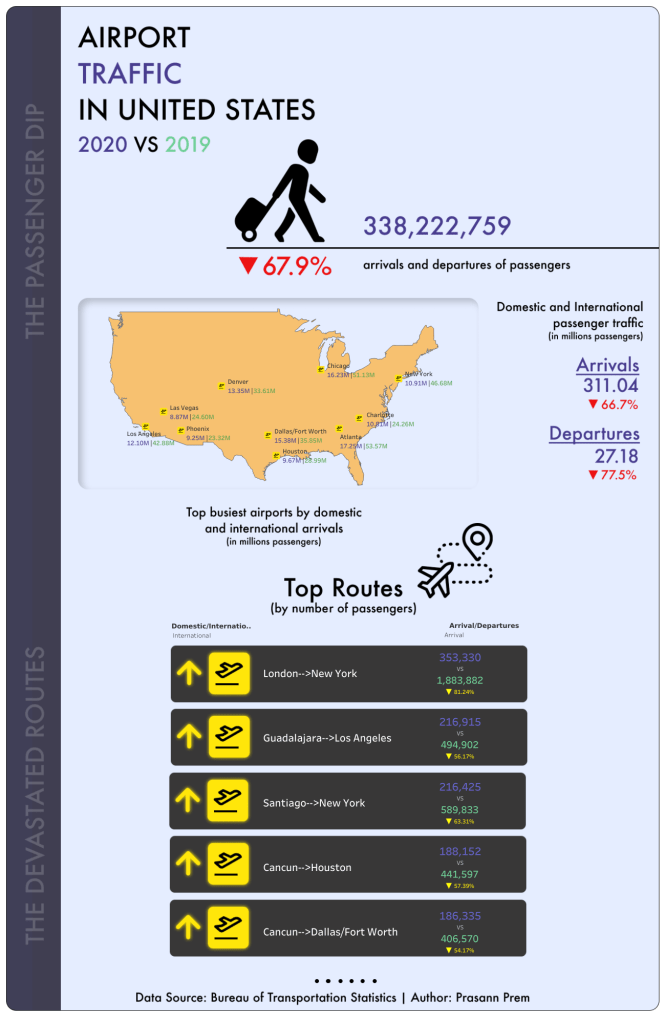
Finally, you could take a different approach entirely and instead visualise data about travel, the travel industry or holiday destinations. That’s exactly what Prasann Prem did here for a #MakeoverMonday earlier this year:
How do I enter?
The process is simple:
- Source your data and build a viz that somehow touches upon the chosen theme for the month.
- Upload your viz to Tableau Public or somewhere where it can be openly viewed online.
- Fill in the submissions tracker (embedded at the bottom of this post) so we can keep track of who is participating. This step is essential if you want to request feedback or be credited in the wrap-up blog post.
- If you opted in for feedback in step 3, the co-hosts and myself will provide some constructive feedback on your viz after the submission period closes.
Top Tips
- You can use any data set which fits the theme (assuming you have permission to share it publicly).
- Always remember to credit your data source/s on your viz.
- Refrain from using any images or logos on your viz unless you have permission to do so.
- Remember the Iron Viz judging criteria and try to focus on all three; Design, Storytelling and Analysis.
- Think outside the box!
Meet the Co-hosts
I’m very excited to announce that I’ll be teaming up with Brian Moore and Jacqui Moore this month!
Jacqui Moore

Jacqui is a data visualization specialist with 10 years of experience in data analytics and a background as a DataViz and Analytics consultant, COE leader, and BI analyst. She loves creating data solutions that are enjoyable and easy to use, and supporting others in their dataviz and Tableau journey. Jacqui co-leads the Boston Tableau User Group and #TheSDGVizProject, and in 2020 was named a Tableau Ambassador and Tableau Public Featured Author.
Brian Moore

Brian is a Senior Data Visualization & Analytics Consultant, a Tableau Public Ambassador, a Co-Leader of the Boston Tableau User Group, a Co-Leader of #TheSDGVizProject, and general Tableau fanatic. Brian loves to help others leverage the power of Tableau to get the most out of their data, both as a consultant, and through his work with the community.
When is the submission deadline?
The deadline for submissions is midnight PST on Sunday, 5th September. Please use the submissions form below to submit your entry.
Feedback will be provided (to those who request it) via a conversation recorded and posted to YouTube between Brian, Jacqui and I, shortly after the deadline date. On the submissions form you can specify if you require feedback focused on the Iron Viz scoring criteria (design, storytelling and analysis) or more general data viz feedback.
Please note, if we receive a large number of feedback requests (more than we can cover in two hours), we’ll initially prioritise those from Tableau beginners or those entering #IronQuest for the first time. Any remaining feedback will be shared with the authors directly via email.
Continue the conversation and connect with other participants by following the #IronQuest hashtag on Twitter and LinkedIn.
Thanks for reading and we look forward to seeing your entry!
