
The annual Tableau Conference was a virtual affair again this year. Pre-Covid-19, the global Tableau Community would have descended upon exciting locations such as New Orleans or Las Vegas, but this year we once again attended the conference from the comfort of our own homes.
While the thought of attending another virtual conference may not exactly get you excited like experiencing the conference in-person would, I think Tableau, and the wider community did an excellent job in making the virtual conference an engaging, fun and fulfilling experience. The conference was attended by over 100,000 people; many of whom have likely never had the opportunity to attend an in-person Tableau Conference.
Just like a regular conference I wore Tableau swag every day, I caught up with Tableau friends from across the globe, I had a crammed schedule from morning until night and I felt exhausted, but refreshed and full of inspiration by the end of the week! The only differences were that my feet didn’t hurt and I didn’t have to fly thousands of miles across the Atlantic to enjoy the conference experience!
This year, I think that the conference organising team did an excellent job in making room for new and diverse voices from the community. There was a good balance of sessions from familiar names, alongside sessions from newer authors or first-time speakers such as Priya Padnam, Chimdi Nwosu, Dzifa Amezo and Thi Ho. The common theme throughout these sessions was encouragement, support and belonging. The community is open to all, regardless of your background or skill level. With dedication and regular participation, combined with support from the community, nothing is stopping you from following in the footsteps of the Tableau Public authors or community members that you admire today. Particularly if you are new to Tableau and/or the community, I hope the conference content inspired you to take the first steps and get involved!
Here are my #data21 highlights (in no particular order). Note: You won’t find any notes on the Opening Keynote or Devs on Stage here. Those were fantastic sessions with lots of exciting new features announced but this post is focused on breakout sessions and other accompanying activities.
My Favourite Sessions
The conference schedule was jam-packed with inspiring talks, educational content and guest speakers. With over 300 sessions, it was impossible to catch everything live. Thankfully, the majority of sessions are now available on-demand on the conference platform.
Below are some sessions I would highly recommend watching back if you missed them live. This isn’t an exhaustive list! These are simply sessions I enjoyed or those that I missed that have been recommended to me. Just like Netflix, navigating the on-demand platform can be daunting so hopefully, these recommendations will provide you with somewhere to start.
Tableau Speed Tips: Shortcuts and Tricks for All Skill Levels: Lorna Brown, Ann Jackson, Heidi Kalbe
Tableau Speed Tipping has become a conference favourite since Andy Kriebel and Jeffrey Shaffer started running speed tipping sessions several years ago. These sessions are always snappy but straight to the point, bursting with mind-bending tips! Ann and Lorna are seasoned experts in this space and this year they were joined by Heidi for the first time (although Heidi is no stranger to presenting Tableau tips). In this fast-paced session, they each share multiple bite-sized tips which you can easily apply in your own work. A conference must-watch!
Note: If you struggled to keep up with the tips during the live broadcast, you can now watch this session back at a pace you are more comfortable with.
Find Your Voice: How Community Builds Confidence: Priya Padham
In this heartwarming session, Priya describes her Tableau journey whilst welcoming familiar community voices from across the globe to join her to share their stories and advice too. This session was a breath of fresh air! It was a joy to hear from so many people from across the community and it was a reminder of how diverse and unique our community really is.
Minimalist Designs for Maximum Communication: Chimdi Nwosu
Chimdi burst onto the Tableau Public scene around 12 months ago when he started participating in #MakeoverMonday. Since then, he has been an unstoppable force! With his fantastic minimalistic design skills, Chimdi has earned himself 3 VOTD nominations and he was a top 10 finalist in the 2021 Iron Viz competition! In this session, Chimdi completes a live build of his US Student Debt viz (pictured below), highlighting how a single chart can be used to communicate multiple messages.

[Alt text: A screenshot taken from the session which shows Chimdi live-building his US Student Debt Viz. The viz is designed against a dark background and features a US map with squares used to encode loans in each state, by type, where each loan type is shown in a different colour and the size of the square represents to loan amount in the 20/21′ school year.]
The Performant-First Approach to Designing Efficient Workbooks: Ben Bausili
Nobody enjoys working with slow, inefficient workbooks but sometimes it can be difficult to pinpoint exactly what steps to take to improve performance. In this session, Ben shares how to plan, create, and deploy dashboards with efficiency and performance in mind. You won’t want to miss the advice shared in this session, such as the efficient calculation tips shared in the screenshot below!
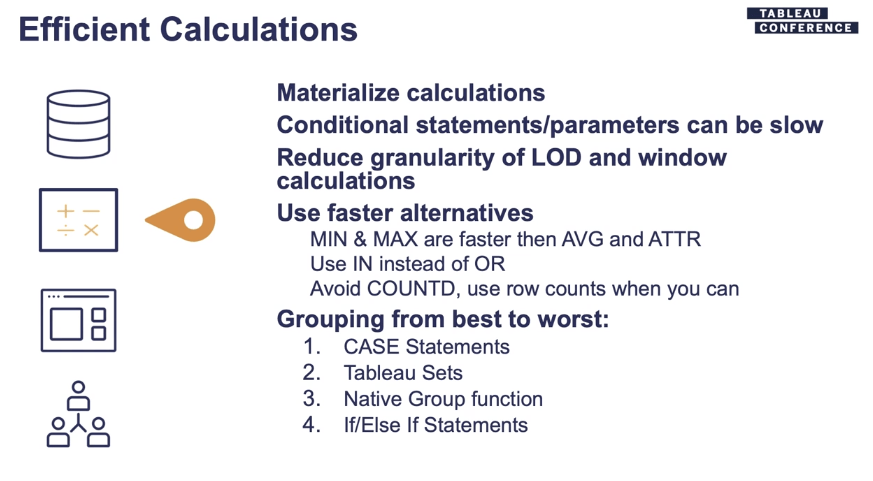
[alt text: A screenshot taken from the session which includes some tips on how to write efficient calculations. The tips include materialising calculations or using faster alternatives, for example, MIN and MAX tend to be faster aggregations than AVG or ATTR.]
Inclusive Design: Making Dashboards Engaging, Informative, and Accessible: Emily Kund
Are your dashboards excluding people? In this session, Emily (who has become our go-to accessibility expert in the Tableau community) highlights the importance of designing inclusive dashboards and emphasises how inclusive design can help everyone to access and understand data. Emily shares valuable tips and advice that can be easily implemented to ensure that your dashboards are accessible for all.
Know Your Audience: Designing Dashboards with the End User in Mind: Toni Pragov
This has to be one of my favourite sessions of the conference! In this session, Toni shared their experience of creating dashboards that didn’t land with their audience, whether due to lack of data, mistrust in the data or confusing designs that did not meet the users needs. If you’ve been creating dashboards for a while, you’ll know how frustrating this can be!
In this session, Toni shared several tips that can help ensure your dashboards are adopted by your audience and get the point across, effectively!
Make It Better: Tips for Better Dashboard Design: Ken Flerlage and Kevin Flerlage
In this session, Zen Masters, identical twins and authors of flerlagetwins.com started by sharing a less-than-perfect example of a dashboard. Together, they ‘made over’ the dashboard by redesigning each chart or element, explaining why it wasn’t effective in the original design and sharing step-by-step tips and design hacks along the way. The result was a beautiful and concise dashboard! If you are looking for ways to improve your Tableau dashboard designs, you won’t want to miss this session!

[alt text: A screenshot taken during the session which shows Ken and Kevin in the process of making over the Superstore Sales Analysis dashboard which was the main focus of their talk.]
Tableau Zen Masters Share Their Best Advice – Part 1 & Part 2
In this two-part session, Tableau Zen Masters shared their best tips or words of advice in rapid-fire form! Each Zen Master was given 2-minutes to share something useful; whether that be a hands-on Tableau tip or general advice to help you on your Tableau journey. It was great to see many of the Zen’s come together and share their unique perspectives or useful tips that you can apply in your work TODAY. I’m still kicking myself that I missed the deadline to submit something for this session!
I was fortunate to have two sessions on the agenda at this years’ conference! I love sharing my perspectives on data culture, enablement and community topics so it was an honour to be a part of TC and speak about these topics this year.
Firstly, I had the pleasure of working with Tableau Ambassadors Dzifa Amexo and Thi Ho on Shhh….Secrets from the Experts. In this session, I interviewed Dzifa and Thi about their unique Tableau journeys and together, we shared advice for anyone looking to get involved in the Tableau Community to level up and improve their Tableau skills.
Secondly, I joined a panel of data leaders and together we were interviewed by Sam Priddy from Tableau in the From Soup to Nuts: How Data is Turned into Insight session where I spoke about the work that my team and I are involved in at Red Hat. Each of the panelists brought their unique perspectives and advice on how we can shift legacy mindsets and drive a data-informed culture in our organisations. It was great to chat with, and learn from those that have been in similar situations and understand how they worked to overcome barriers to implementing a successful data culture at work.
All of the sessions I’ve shared so far are useful to everyone, regardless of your role or skill level with Tableau. I took an active interest in sessions that focused on building a data culture, data literacy and data leadership this year. I found the following sessions which focused on these topics particularly insightful:
- Build a Sustainable Analytics Strategy at Scale (Blueprint) – Keith Helfrich (Action Analytics) & Kiyoshi Jones (Tableau)
- Creating a Data-Driven Organization: The Role of the Everyday User – J. Michelle Maraj (Lyft)
- Data Literacy: Getting Started and Tips for Success – Sarah Nell-Rodriquez (Tableau), featuring speakers from Elsevier
Iron Viz
This years’ Iron Viz final featured Lisa Trescott, Pradeep Kumar G and Samuel Parsons going head-to-head in the ultimate viz competition!
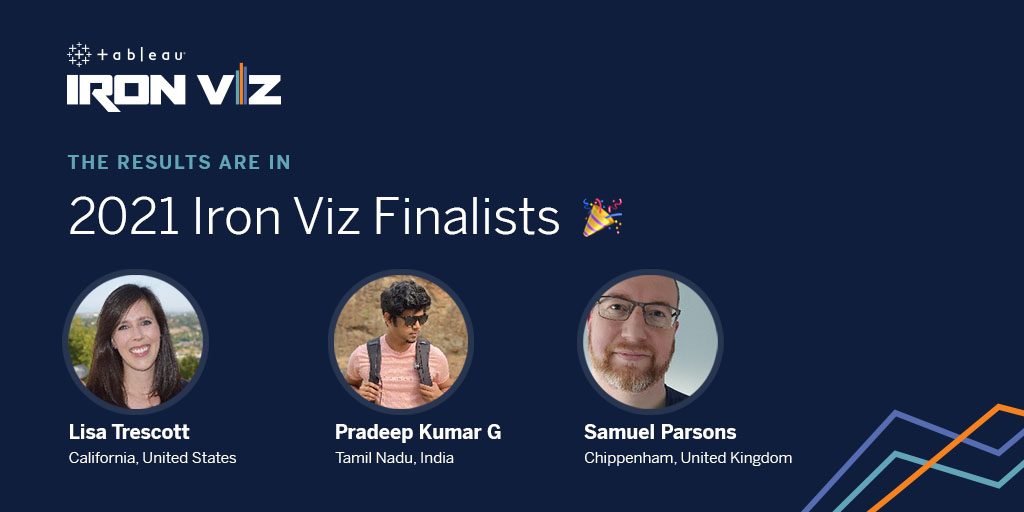
The theme for this year centred around music. Chartmetric provided a deep data set, global in scope, of nearly 200 million records spanning several years. It included artist popularity, metadata, YouTube listening data, and loads of Shazam history. Each participant had 20 minutes to create their own visualisation using the same data.
I don’t want to recap too much here. That’s not the purpose of this post. Instead, I would encourage you to watch the recording and read the recap post from Tableau Public here.
Each of the participants did a fantastic job in creating compelling, creative, and well-crafted vizzes during the final! Dare I say they made it look easy (which it isn’t, by any stretch of the imagination)! A lot of blood, sweat, and tears go into every Iron Viz entry. What you see during the final is only a fraction of the work.
I want to give a huge congratulations to Lisa Trescott on being crowned Iron Viz 2021 Champion!! I was particularly emotional after Lisa’s win. Not only because she is the first woman to achieve this in a very long time, but also because Lisa mentioned me in her acceptance speech. Lisa said my blog post ‘Reasons to Enter Iron Viz 2021’ was the primary driver for her entering the competition for the first time this year.
I shared my more detailed thoughts on this momentous event shortly after Lisa’s win through a thread on Twitter:
I am so so incredibly proud of @LisaTrescott! [a thread]
When the #IronViz feeders launched this year I wanted to encourage participation, particularly from first-time entrants. Every year, I hear from people who are apprehensive about entering #IronViz for various reasons. Perhaps it’s imposter syndrome, perhaps they feel like they don’t have the skills or experience required. Regardless of the reason, when the feeder entries start to come through on social media, it is intimidating…for all of us!
That was one of the main drivers that led me to launch #IronQuest in 2019. I wanted to provide people with a platform to practice #IronViz-style skills in a safe environment, all year round. A key element of IronQuest is feedback, which all participants can opt-in for.I don’t run #IronQuest while the #IronViz feeder is on, so I decided to do something a bit different this year. I gathered together some friends from the #datafam to provide a feedback network for #IronViz feeder entrants. Together, we worked with over 20 participants to provide feedback and help them to refine their vizzes. One of those participants was Lisa Trescott. Lisa was a first-time entrant and had published this awesome viz on Ru Pauls Drag Race Lip Syncs.
Despite running the feedback initiative, I still saw tweets on my timeline from people saying they felt like giving up and not entering the competition. Either they were intimidated by some of the impressive early entries, or they were battling with data or design issues. So, as a final attempt at getting people to not give up & participate, I started posting motivational GIFs and messages on Twitter as the deadline approached. A few people, such as CJ Mayes, said that this gave them the final push that they needed to get their viz completedAnd, as I’ve done for the last few years, I posted a blog post with a few tips and words of encouragement for anyone doubting themselves. I first published a ‘Reasons to Enter Iron Viz’ post in 2019. A lot has changed since then, both in terms of the Tableau Conference, the Iron Viz feeder process, and my perspective on this topic.
I want everyone to recognise that Lisa is the only the 4th woman to reach a global #IronViz final; preceded by Lindsey Poulter in 2019, Kelly Martin in 2013 & Anya A’Hearn in 2012. Add to that, a woman hasn’t won the competition since Anya in 2012, 9 YEARS AGO!
What Lisa Trescott has achieved today is huge! It’s a recognition that a woman CAN do this. For so many years, there was no female participation in the #IronViz final at all. As a result, women lost confidence in the competition. You can’t be what you can’t see, after all. So once again, I want to recognise Lisa Trescott, not only for her incredible viz and storytelling but for paving the way for more women to participate in #IronViz, with confidence, in the future.Sorry for the long tread but I had a lot to say!
The Vizzies
The Vizzies are always a conference highlight for me. I’m so glad that Emily Kund and Matt Francis were able to bring them to us virtually again this year! For those that don’t know, the Vizzies are similar to the Oscars, but for the Tableau Community. Community members nominate others in the community for a range of awards such as ‘Best Blog’, ‘Server Guru’ and ‘Most Technically Sound’. It’s worth noting that Zen Masters are exempt from receiving Vizzie awards.
A total of 136 people from across the community were nominated for Vizzie Awards this year!! I was so proud to see so many new names featured on the nominations list; many of whom were either new or lesser-known in the community last year. It was great to see many #IronQuest participants featured too.
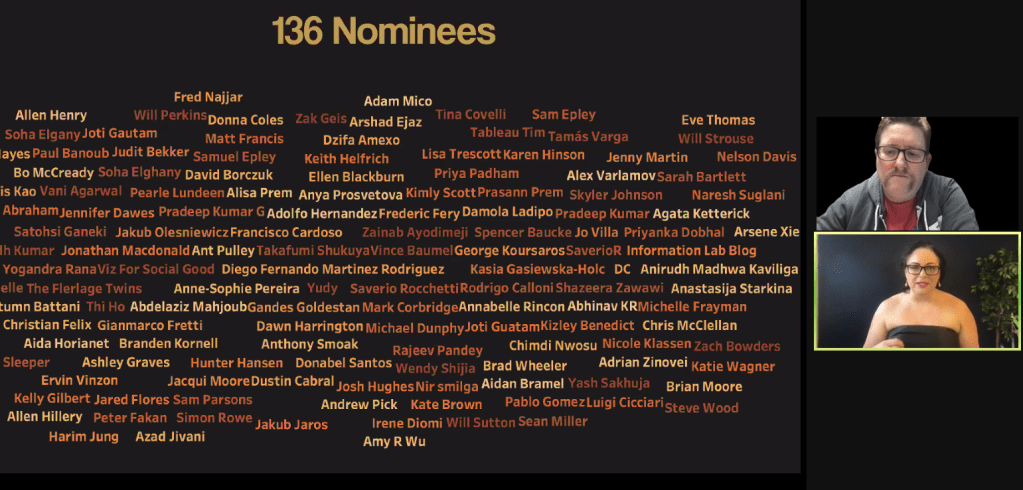
[alt text: A screenshot of a wordcloud shown during The Vizzies event which shows the names of all 136 people who were nominated for Vizzie awards in 2021. To the right, Matt Francis and Emily Kund are pictured during the webinar presenting.]
This years’ awards were dominated by two talented individuals; Chimdi Nwosu and CJ Mayes! Congratulations to you both! For those that don’t know, Chimdi and CJ are both talented Tableau Public authors, Tableau Public Ambassadors and community members. Rarely a week goes by where they don’t publish a beautiful new viz, or contribute to the community in other ways.
In terms of background, Chimdi burst onto the Tableau scene in mid-2020 when he started submitting vizzes for #MakeoverMonday and has been participating in the community consistently ever since. Chimdi has shown that hard work truly does pay off and he has shown tremendous skill growth in his Tableau Public work since he started. Check out his Tableau Public profile to witness his growth journey for yourself. If you missed it, catch Chimdi’s TC session on minimalistic designs for maximum impact (referenced earlier in this post).
Meanwhile, CJ joined the community around the same time as Chimdi, and started getting involved by working on passion projects in Tableau during lockdown. CJ’s specialism is sports data and he has become well-known for this circular or otherwise technical wizardry in Tableau. Given his love of sports, CJ was recently selected to join the #SportsVizSunday leadership team. He also gives back to the community through his website which is full of technical how-to guides (which help make his wizardry more accessible to those wanting to learn new techniques), viz reflections and community interviews through his “What’s Good?” blog series.
This year’s award winners were:
The Kelly Martin Best Designer Award – Chimdi Nwosu
It came as no surprise to me that Chimdi won this! Chimdi’s vizzes are well-executed and designed, with special attention paid to colour, layout and composition. Chimdi vizzes regularly and has shown tremendous growth this year. I can’t wait to see what he achieves next!
Data Storyteller Extraordinaire – Kimly Scott & Chimdi Nwosu
This award was a tie between Chimdi and Kimly. Kimly designs beautiful vizzes that tell compelling stories. A regular #IronQuest participant, Kimly’s vizzes never fail to disappoint. She is a Tableau Public Ambassador and has been nominated for Tableau Public ‘Viz of the Day’ 7 times! Like Chimdi, she was also an Iron Viz 2021 top 10 finalist.
Tableau can effing do that? The Elissa Fink Award (AKA The Hackiest) – CJ Mayes
CJ’s technical wizardry no doubt earned him this award. Rarely does he post a viz that doesn’t leave us questioning how he did it!
Server Guru – Zak Geis
Over the last few years, Zak has established himself as one of the few go-to server gurus in the community. If you have any server questions, Zak is a great person to ask!
Data Do-Gooder – Frederic Fery
Over the last year or so, Frederic has become actively involved in #VizForSocialGood as a chapter leader in Australia. In addition to his work with non-profits, Frederik is an advocate for equity and diversity and often vizzes about the inequalities faced by the Aboriginal and Pacific Islander population in Australia. He is also a frequent #IronQuest participant!
Best Blog – CJ Mayes
Most Technically Sound – CJ Mayes
Notable Newbie – Chimdi Nwosu
Must run on coffee or Coke – Adam Mico
I often joke that Adam never sleeps! He always seems to be doing something; whether that’s publishing new vizzes, recording TUG’s or webinars, writing blog posts, or just generally being active in the community. If anyone must run on coffee or Coke, it’s Adam!
Prepstar – Jenny Martin
Jenny is a leader (aka ‘Dr Prepper’) of the #PreppinData project. Each week she shares a new Tableau Prep challenge and showcases her mastery of the Tableau Prep platform through regular TUG talks and blogs.
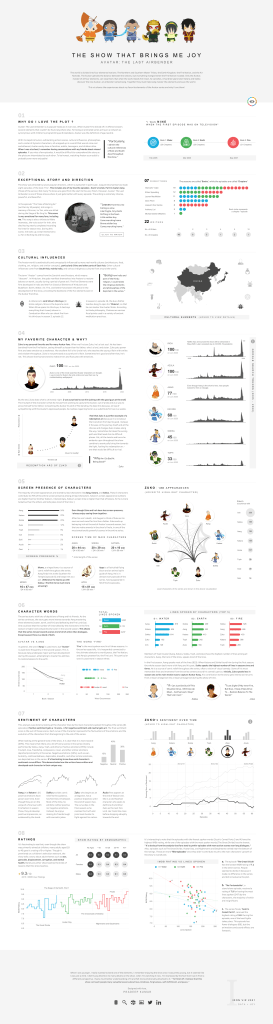
Favorite Viz of the Year – ‘The Show That Brings Me Joy’ by Pradeep Kumar G
Pradeep’s ‘The Show That Brings Me Joy’ viz was his entry into the 2021 Iron Viz feeder competition (that later won him a place in the final). The viz focuses on ‘Avatar: The Last Airbender’ and showcases some detailed analysis of the show, the characters, and the reasons why it’s special to Pradeep personally. The viz is beautifully designed, effectively and innovative and it’s no surprise it won the Favourite Viz of the Year!
The Michael W. Cristiani Community Leadership Award – Adam Mico & Michelle Frayman
[alt text: Michelle (left) and Adam (right) pictured smiling after being announced as Vizzie 2021 winners]
The Community Leadership Award has a special place in my heart. The award is named after Michael W. Cristiani, who sadly passed away a few years ago. Michael was a loyal member of the Tableau community and had attended the Tableau conference every year since the very beginning. Not only was Michael an advocate of the tool itself but he was also passionate about building connections with others across the Tableau Community. While he wasn’t the most outspoken community member, behind the scenes he was always helping to mentor, connect and introduce people.
I had the honour of winning this award in 2018, the first year it was renamed after Michael. Winning this award was a shock for me, but also an incredible honour. Last year, I was delighted when it was awarded to Adam Mico and this year I’m thrilled to see it awarded to two of my good friends; Adam Mico and Michelle Frayman.
Firstly, Adam is no stranger to this award. After winning the Michael W. Cristiani Award last year, Adam wrote:
“It means so much that this collection of people who I admire so deeply has accepted me — it propels me to push myself in this previously unfeasible direction. Even without earning this award, I cannot thank you enough because you inspire me every single day and added hope and personal purpose to my life.
My main future goal is simple on the surface, but will not spend the rest of my life trying to apply; it’s to never let down the legacy of Michael W. Cristiani or those that have earned the award before me and after me.”
ADAM MICO, 2020
Adam continues to be involved in all aspects of the community. He may not be posting vizzes all of the time but he does an incredible amount of work behind the scenes. He’s involved in both VizConnect and Mentoring Meetup and just like Michael, he is an encouraging voice, advocate and is always connecting people in the community. He truly deserves this award and I’m honoured to be able to call Adam a friend.
Now, the second winner of the Michael W. Cristiani Community Leadership Award this year was Michelle Frayman! Michelle is also a good friend of mine and, just like Adam, Michelle is involved in many aspects of the community. Like many of us, Michelle joined the community through #MakeoverMonday. However, Michelle has gone on to lead, or contribute to, multiple other community initiatives. Every week, Michelle co-leads ‘Viz Feedback Office Hours’, alongside Zak Geis. Together they provide viz feedback to those who request it during a one-hour Zoom call. Michelle has also been involved in #IronQuest, both supporting me during a feedback session and as an active participant. Michelle also volunteered as part of the Iron Viz feedback sessions I led earlier this year.
I can’t think of anyone more deserving of this award than Michelle. Michelle is a pillar in our community and it simply wouldn’t be the same without her. She’s incredibly humble and often puts others before herself. In fact, it’s highly likely if you’re reading this that you will have met Michelle at some point during your Tableau journey. Michelle is also incredibly kind and supportive and it’s a pleasure to have got to know her through the community.
Congratulations to all of the 2021 Vizzie Award winners!
Remember, the Vizzies weren’t shown as part of the conference scheduling so you won’t find them if you are looking for the recording on the conference platform. Instead, watch the recording of the event here:
Braindates
Braindates have been a conference favourite of mine since they were introduced a few years ago. The concept allows you to schedule and/or join meetings with others, either on a 1-2-1 basis or in groups of up to six. Braindates are scheduled around a topic or a shared interest and other conference attendees can ‘browse’ the Braindate listings and sign up to any Braindates which take their fancy.
This year I initially scheduled four group-discussion Braindates where we discussed organising internal TUG’s, running a Tableau Doctor initiative at work and approaches to user training. I later joined several other Braindates, including a discussion of data viz and user experience design in Tableau, led by Ken Flerlage, and a session with Keith Helfrich on building a sustainable analytics strategy at scale (a follow-up to his insightful TC talk).
Through my Braindates, I met a wonderful group of people from across the world. I had the opportunity to have engaging conversations with those facing similar challenges to me and learn from their approaches, meet some friends in the community who I’ve never had the opportunity to speak to in person before, have engaging talks about internal user groups and community building, as well as meeting lots of newer community members to share some advice to help them get started.
If you weren’t able to join Braindates this time, I highly recommend getting involved when the next Braindate event is organised by Tableau (usually they are run every few months).
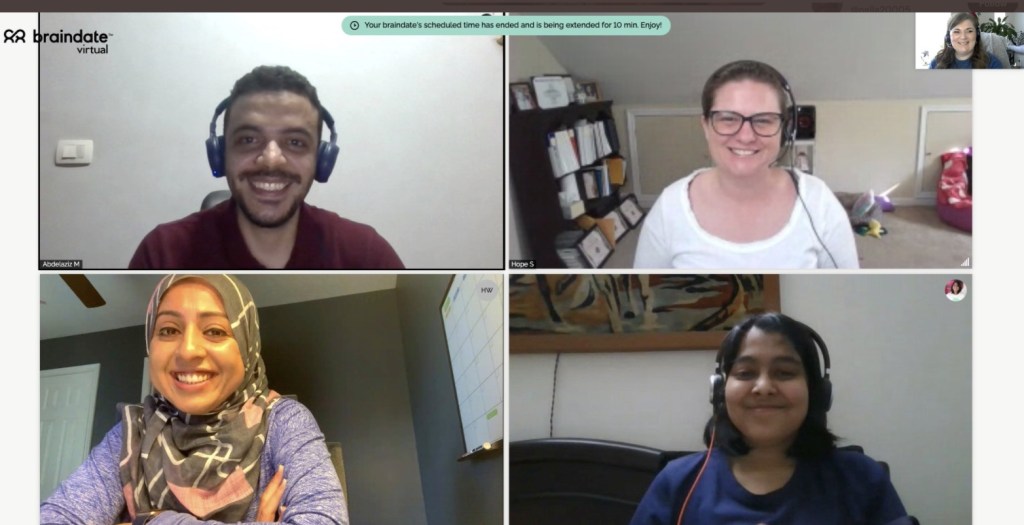
[alt text: A photo taken from my internal TUG’s Braindate, featuring 5 participants on a Braindate call smiling for the camera]
Tableau Doctor
As a Zen Master, I had the opportunity to help out with Tableau Doctor at Tableau Conference this year. If you don’t already know, Tableau Doctor is like a real doctor, but for Tableau problems. Attendees can book appointments to see the Tableau Doctors, who are made up of both Tableau staff and Zen Masters.
I completed a total of 8 Tableau Doctor appointments at this conference and these sessions were one of the highlights of my week. I had the opportunity to help a wide range of people across the three days, each with completely different challenges or questions. In many of the sessions, I provided viz feedback to users early in their journey to help them design more compelling and engaging visualisations. It was so rewarding to share solutions that I knew were going to massively help people with their day-to-day work.
Zoom Parties
The Community is what makes the conference so special for me. Since this year was virtual, sadly (most of us) couldn’t enjoy all of the get-togethers we are so used to. However, this didn’t stop us from connecting with one another virtually.
Several people from the community, as well as Tableau, organised post-event get-togethers and watch-a longs to coincide with the keynotes and big events such as Iron Viz. These made the world of difference to my conference experience! Watching along with others was almost like sitting in the keynote hall with someone to talk to sat next to you. It made the whole conference experience far more interactive and engaging. Through these sessions, I was able to catch up with old friends and meet new ones too.
Later in the week, Emily Kund even organised a special ‘Data Night Out’ event via Zoom, where she invited artist, songwriter and Goodyear’s #FromGarageToGlory winner, Sarah Faith to perform an exclusive intimate concert for us! Sarah’s music was incredible and she even performed her own take on the ‘We Are Data People’ anthem for us! I highly recommend checking out her music on Spotify, and other major streaming platforms!

[Alt text: A picture of Sarah Faith holding a guitar and singing into the microphone during her live performance]
All in all, it was a fantastic three days. I learnt a lot and enjoyed catching up with old friends and making new friends too. If you attended the conference, I hope you enjoyed it as much as I did. If you missed it, be sure to catch all of the conference content on demand.
A big thank you to the Tableau team for putting together such a fantastic event. It was clear how much effort had gone into organising this event. We can’t thank you enough!
Thanks for reading.
