In September/October 2021, I had the pleasure of teaming up with the #SportsVizSunday team to collaborate on #IronQuest. Sports Viz Sunday provides a platform for those interested in sports to come together and explore the world of sports data & visualization, led by Simon Beaumont, Kate Brown, Spencer Baucke, CJ Mayes, Mo Wootten and Simon Rowe. Together, we hosted a ‘Sporting Heroes and Legends’ round where we encouraged participants to source their own data and tell stories dedicated to their favourite sports stars.
We received a total of 31 submissions for this round and welcomed 14 first-time participants to the project! As always, it was fantastic to see the diverse range of topics covered and the creativity shown through the entries. This month we saw participants put together vizzes celebrating their favourite athletes, covering a wide variety of sports including football (soccer), ice hockey, tennis, basketball, golf, and many more! Many authors went with small multiple designs to showcase performance over a series of years or seasons.
We were lucky enough to have two entries recognised as ‘Viz of the Day’ this month too! Congratulations to Abbie and Simon on having your work featured by Tableau Public!
(click the images below to view the interactive vizzes on Tableau Public)
Abbie Taylor – Geva Mentor (Netball)
Abbie’s viz focused on the career of Geva Mentor, an English professional netball player. The viz first looks at Mentor’s seasonal stat’s rankings compared to her teammates, across a series of metrics. For this analysis, Abbie used an interesting take on a bump chart where the only line is that which represents Mentor, with the other marks/players represented as dots (with no adjoining lines). This approach helps to keep the story focused on Mentor, whilst keeping the design simple and easy to follow.
For the second part of the viz, Abbie used radar charts to encourage the reader to compare Mentor to her athletic peers (where both athletes have been their team’s main starting goalkeeper in a given season). The radar charts compare the athletes against four key rankings, with each radar chart representing a different year. Again, Abbie has kept the viz simple by only labelling the year on each radar chart. The other axis labels are explained in the ‘How to Read’ section. This avoids any repetitive labelling, which is often unnecessary in repetitive, small multiple-style designs.
To complete the viz, Abbie included a section to explain ‘What is Netball’, as well as a description of key stats. These are great additions and help to ensure the audience have a basic understanding of the subject matter. Overall, the viz design is simple, yet memorable, using a simple colour palette consisting of different shades of red and grey. I really like the triangle design which diagonally bookends the top and bottom corners, helping to frame the viz.
Well done, Abbie!

Link to viz: https://public.tableau.com/app/profile/abbietaylor1/viz/SportingHeroesLegends-GevaMentor/GevaMentor
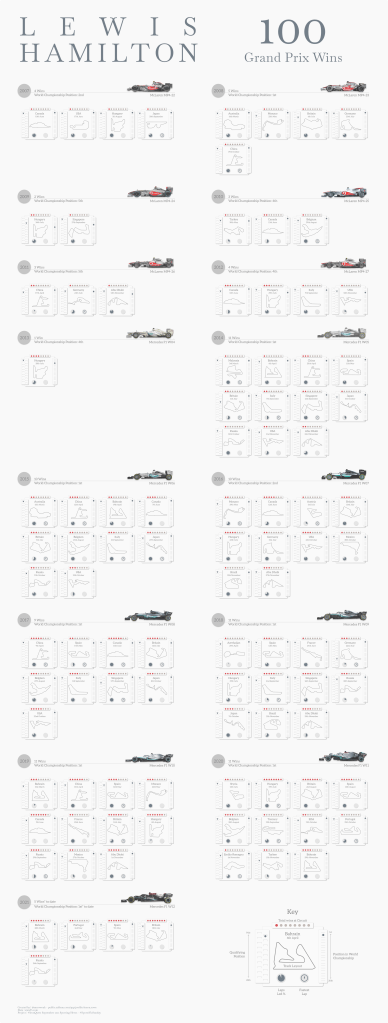
Simon Rowe – Lewis Hamilton – 100 Grand Prix Wins
This stunning, poster-style viz, tracks all 100 of Lewis Hamilton’s Grand Prix wins. For each race, Simon included a tile featuring the key stats using visual elements and a simplified map of the track layout. Whilst the tiles are simple in their design, they are packed full of information with little need for any additional (repetitive) text labels. This helps to keep the design clean, using colour and position to tell the story instead. The design is a repetitive style, making it easy to compare the races against each other. This is a viz to be enjoyed slowly. The more time you spend looking at it, the more you’ll appreciate its innovative design. If you are keen to learn more about his design process and technique, Simon explained how he built this viz during our feedback call.
Well done, Simon!
Highlights
In addition to the vizzes mentioned above, there are a few vizzes I would like to give a special mention to. This month we were inundated with fantastic entries but these vizzes each deserve a special mention for their uniqueness and/or approach to design, storytelling and analysis (the Iron Viz scoring criteria).
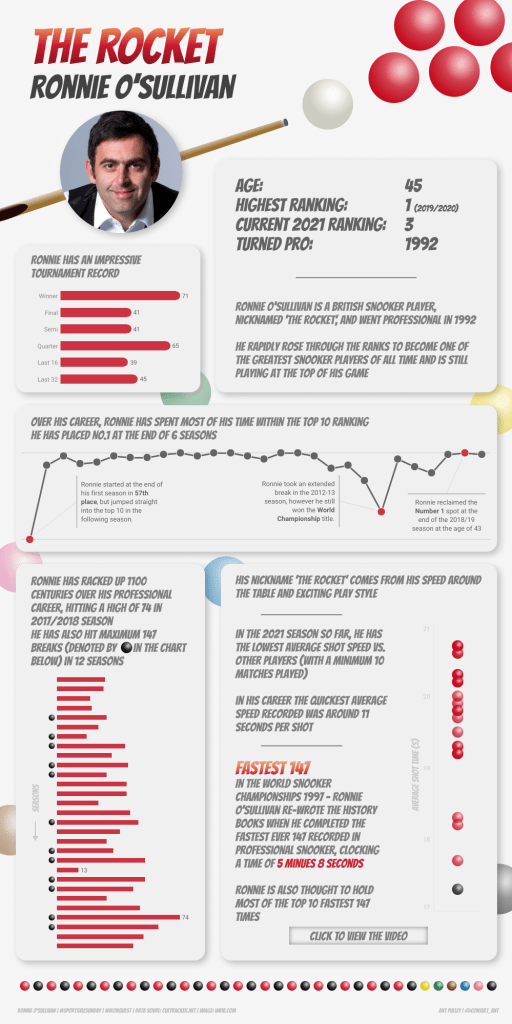
Ant Pulley – The Rocket – Ronnie O’Sullivan (Snooker)
In this viz, Ant follows the career of British snooker player, Ronnie ‘The Rocket’ O’Sullivan. The viz features a light-hearted design with playful typography and snooker ball-style marks, which seems fitting for Ronnie’s personality.
The viz is split across neumorphism-style cards which appear to float against the background. These help to split the viz into distinct sections and aid storytelling. Ant uses annotations to explain the peaks and troughs of Ronnie’s career, whilst he uses black-coloured snooker balls to highlight key moments across different seasons, drawing the eye to these moments. Again, the colour use in this viz is minimal, with the primary colours being red and black.
Link to viz: https://public.tableau.com/app/profile/ant.pulley/viz/TheRocket-RonnieOSullivan/RonnieOSullivan
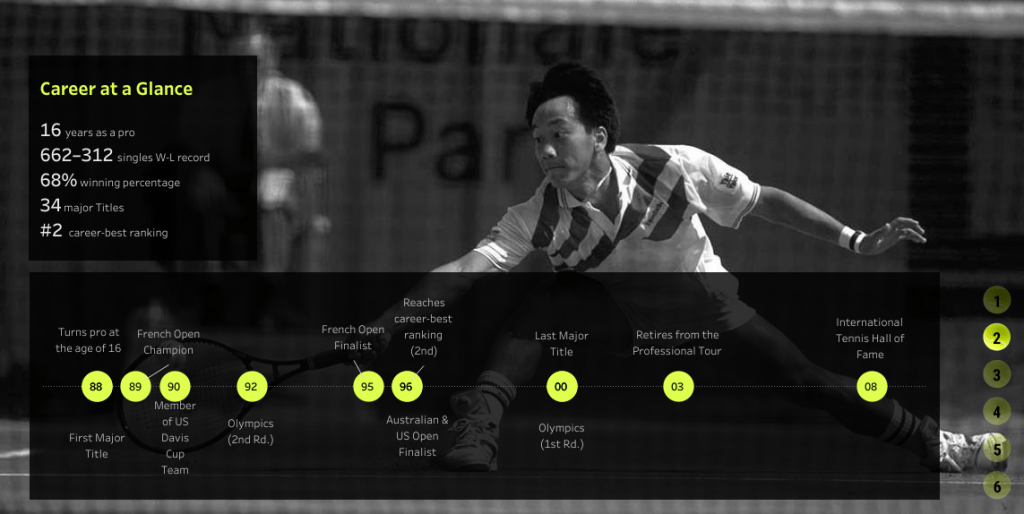
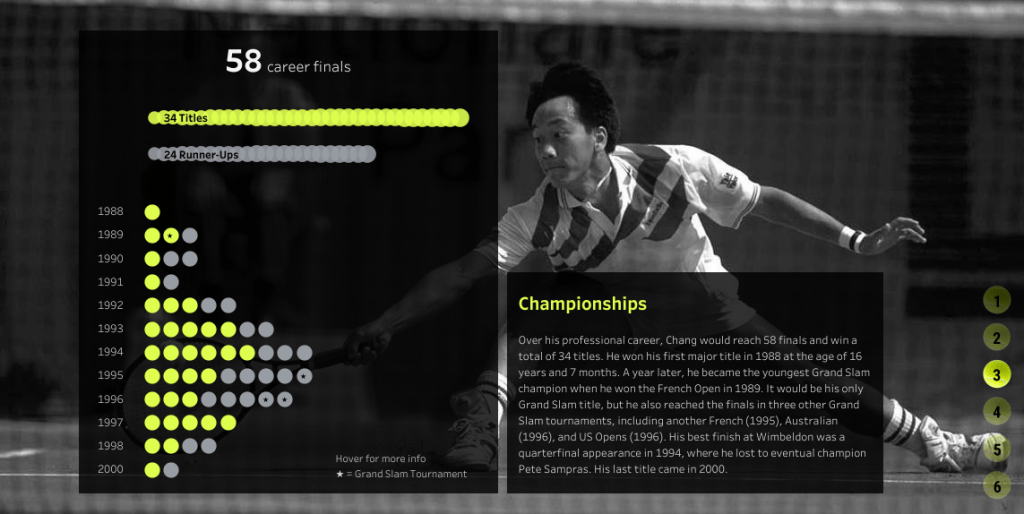
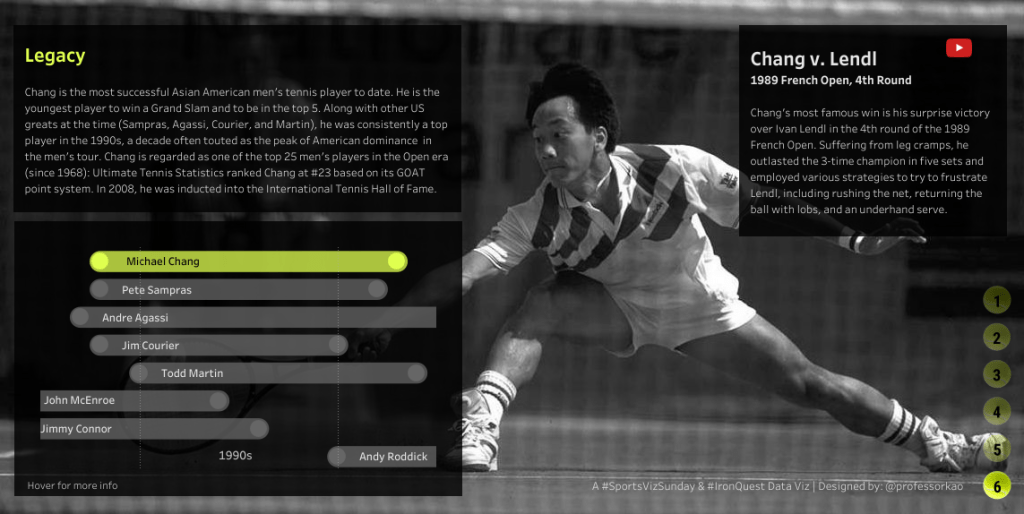
Dennis Kao – Michael Chang (Tennis)
In this viz, Dennis tells the story of Michael Chang’s impressive tennis career. The viz is innovative in design, with the story split across six screens, with each screen using the same image of Chang as the background for consistency. This technique enabled Dennis to keep the viz design small, easily fitting on a single screen, whilst allowing each section to stand-alone, thus supporting storytelling and not overwhelming the user by providing too much information, all at once.
Much like the other vizzes mentioned in this post, Dennis uses only two colours for the majority of the viz; yellow and grey, with yellow used as a highlight colour to focus the story on Chang, where applicable. Each page of the viz is well-explained, with clear instructions on how a user should navigate through the viz provided on the first page. While the design is intuitive, this is a nice touch and helps to ensure the user does not encounter any issues whilst interacting with the viz.
On our feedback call, we had an interesting debate about the design of the timeline included in this viz (shown in the third screenshot below). The timeline shows which other top tennis players competed around the same time as Chang. Here, Dennis kept the story focused clearly on Chang’s career by showing Chang’s career in its entirety but only showing the relevant sections of other players’ careers, where they overlapped with Chang’s. Personally, I like this approach as Chang is the star of this story and this design avoids adding any unnecessary details about other players.
Below are three pages taken from the viz. Check out the viz on Tableau Public for the full experience!
Link to viz: https://public.tableau.com/app/profile/dennis.kao/viz/MichaelChang-IronQuestSportsVizSundaySept2021/1Home
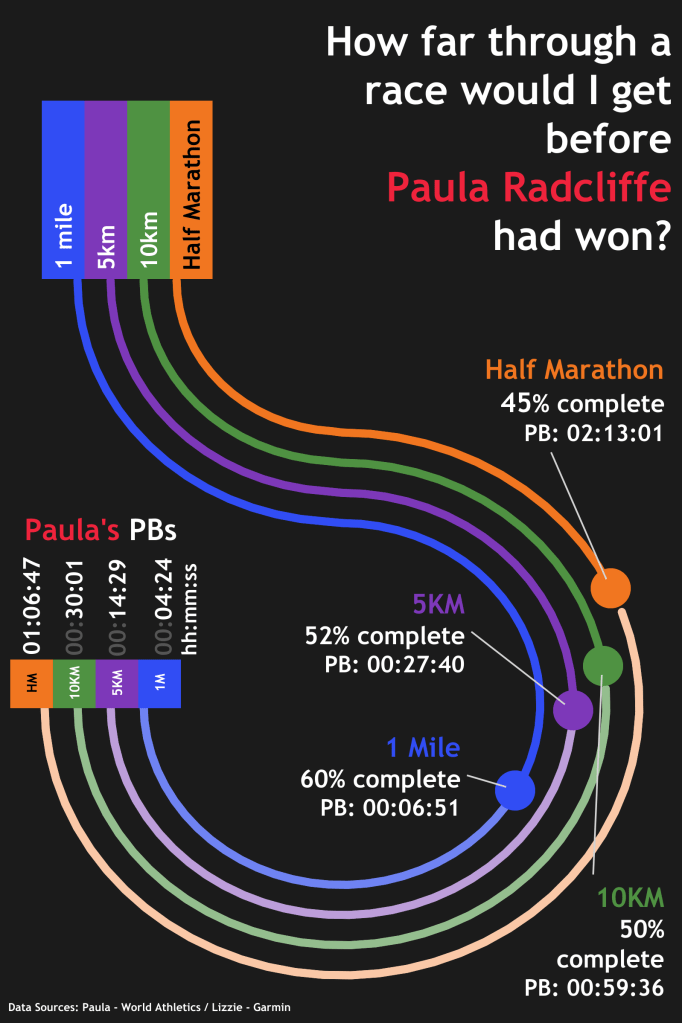
Lizzie Jenn – Me vs. Paula Radcliffe (Athletics)
In this viz, Lizzie compares her run stats to that of former British long-distance runner, Paula Radcliffe, seeking to answer the question “How far through a race would I get before Paula Radcliffe had won?”.
Lizzie’s design features an ‘S’-shaped track with each lane representing a different run distance. Paula’s personal best’s (PB’s) are shown at the end of each track for reference. Lizzie then added markers on each track to show her own PB’s for each distance, and what percentage complete these are, relative to Radcliffe’s PB’s.
I like this viz for its simplicity. It’s not a story about Radcliffe’s career, like many of the other entries in this round. Instead, Lizzie used it as an opportunity to create a quantified self viz which compares her own athletic achievements to that of one of the greats. This approach helps to put into perspective just how fast Radcliffe was, compared to a non-professional (but fast) runner.
Link to viz: https://public.tableau.com/app/profile/lizzie.jenn/viz/MevsPaulaRadcliffe/Dashboard1
Tina Covelli – Jacob deGrom – A Sports Hero Story (Baseball)
In this long-form viz, Tina tells the story of Jacob deGrom, a New York Mets starting pitcher. Not only is this viz visually stunning, but Tina’s approach to storytelling and analysis is fantastic and echoes that of vizzes that have won Iron Viz feeder contests.
Firstly, the background design helps to split the viz into distinct sections. This is particularly helpful in long-form viz designs like this one, where there is a lot of information to scroll through. The sectional design helps to break the viz into more manageable chunks, whilst supporting the storytelling flow. Interestingly, there are no visible borders or separators in this viz. The sections are purely defined by colour.
Tina’s analysis compares deGrom to other league-leading pitchers. She uses a variety of analytic and design approaches for the comparisons, including shading and reference lines. This varied approach enables Tina to use various chart types and keeps the viz interesting. Furthermore, each viz includes a written narrative to guide the reader and it also helps to tell a compelling story.
As a baseball novice, I appreciated the explanation pop-outs which explain each acronym used in the viz! This information is hidden away but is easily accessible to those who need it.

Link to viz: https://public.tableau.com/app/profile/tina1167/viz/JacobdeGrom-ASportsHeroStory/deGrominate
Feedback
For the feedback call, I was joined by four members of the #SportsVizSunday team; an #IronQuest record! This is probably one of my favourite feedback calls to date and it was great to hear different perspectives and advice from the team. In addition to sharing feedback, CJ, Mo and Simon Rowe also presented their own entries at the beginning, explaining their design choices and build process. It was really insightful and a rare opportunity to hear an author present their work live.
Simon Beaumont, CJ, Mo, Simon Rowe and I provided feedback to everyone who requested it during our conversation, which has since been posted on YouTube.
You can listen to our feedback here:
We reviewed the vizzes in alphabetical order (by authors first name) to make it easier for you to jump straight to the feedback for your viz. The video is also split into chapters to make it easier to jump to vizzes of interest.
In this video we cover vizzes by the following authors, reviewed in this order:
Aakarsh
Abbie Taylor
Ali Tehrani
Ant Pulley
Basak
Dan Chissick
Dennis Kao
Jared Flores
Kirk Munroe
Lizzie Jenn
Muhammad Azhar
Radhika Rangarajan
Saverio
Shreyash Singh
Simon Arira
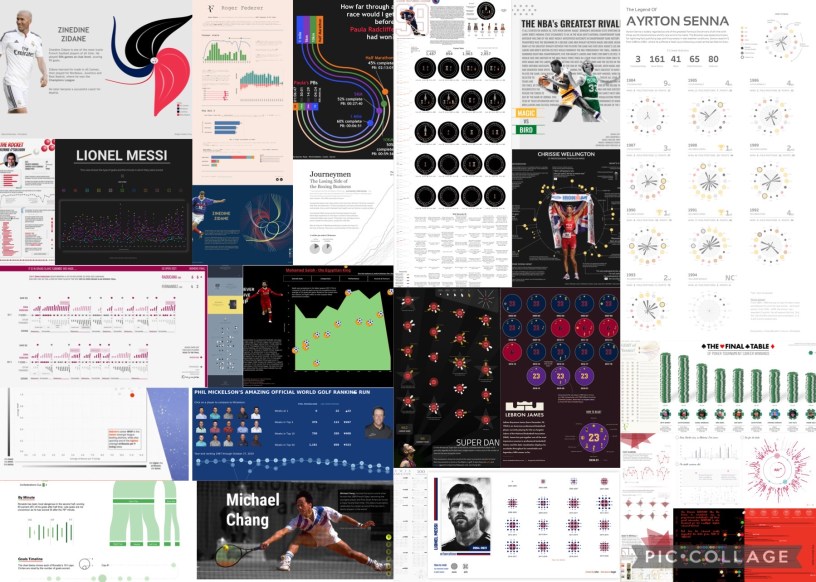
All Submissions
THANK YOU to everyone who submitted entries for taking the time to create and share your work! Also, a big thank you to the #SportsVizSunday team for being fantastic co-hosts.
All of the entries are posted below (except for those mentioned above) in alphabetical order by first name. If you tweeted your viz or thought you submitted one via the Google Form but don’t see it here, let me know and I’ll work to include any additional entries ASAP.
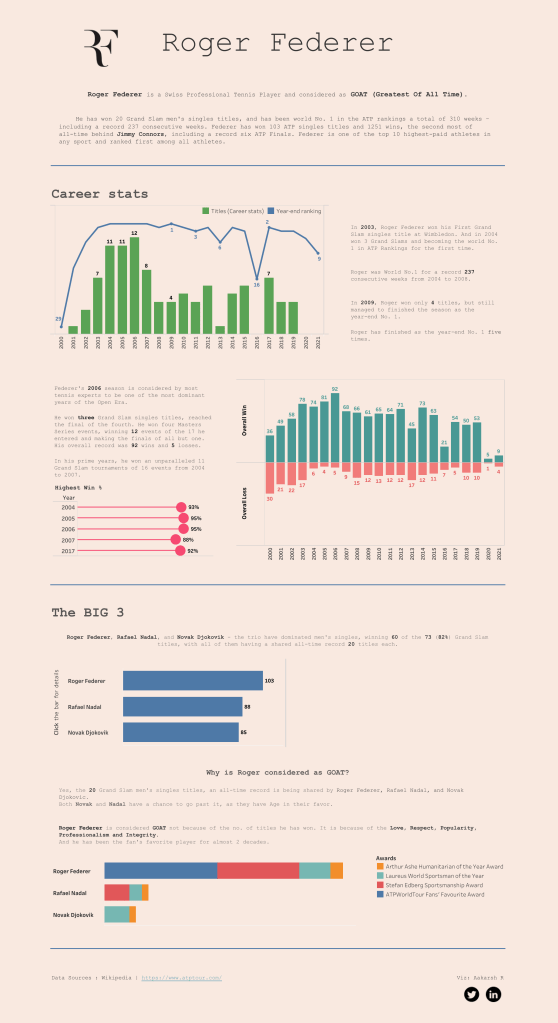
Aakarsh – Roger Federer
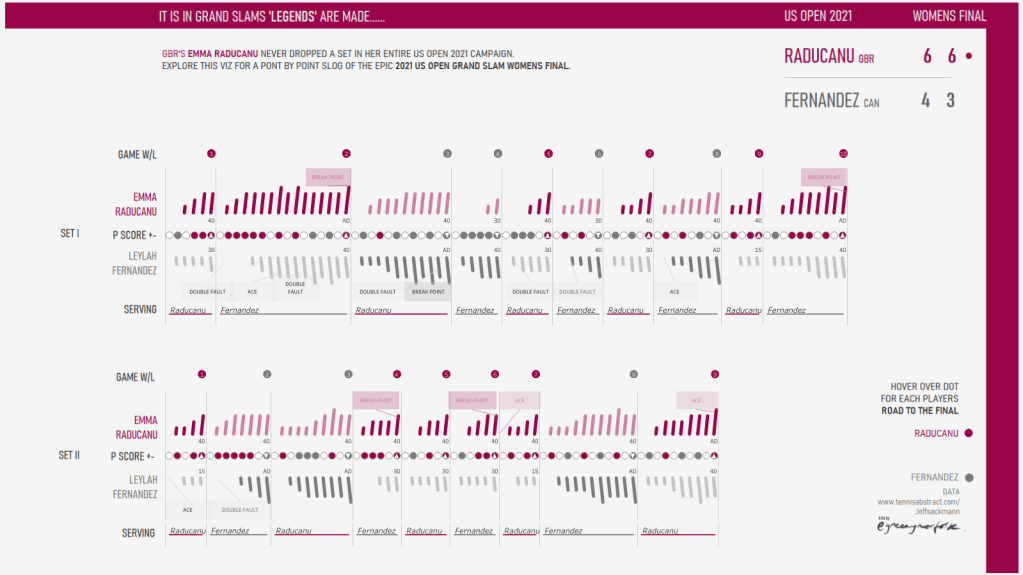
Adam Green – US Open Grand Slam Women’s Final 2021
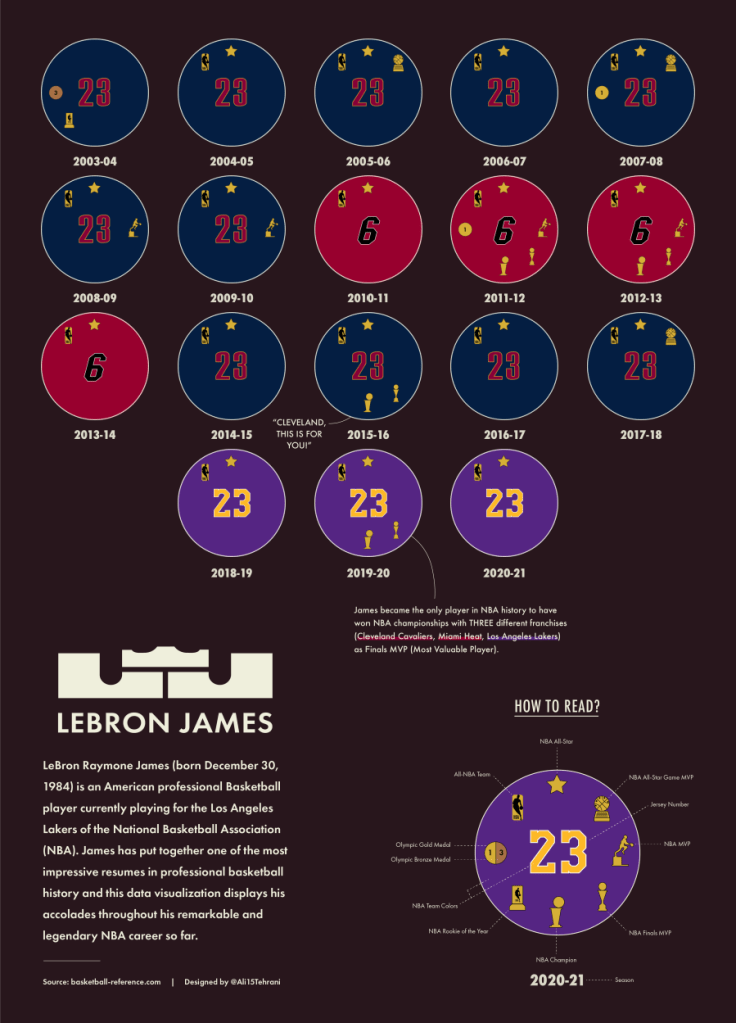
Ali Tehrani – Lebron James
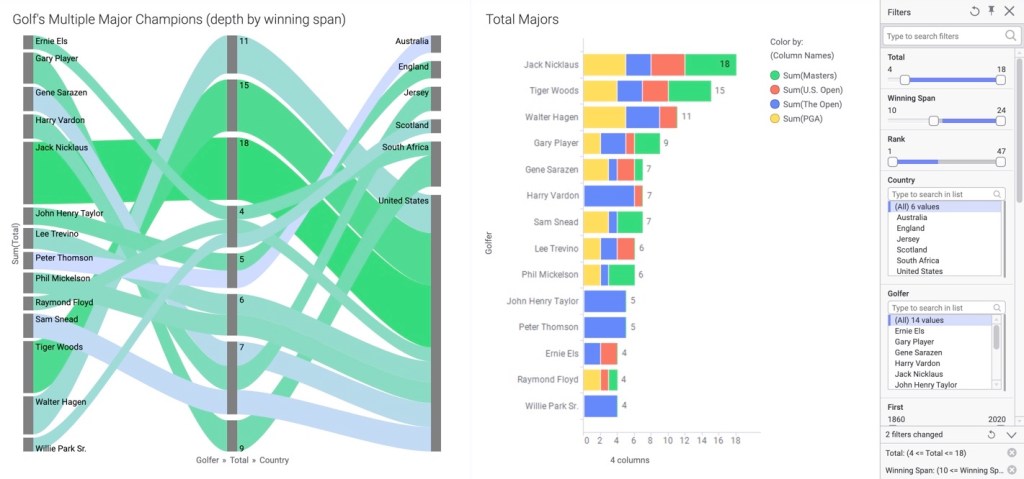
Brett Stupakevich – Golf’s Multiple Major Champions
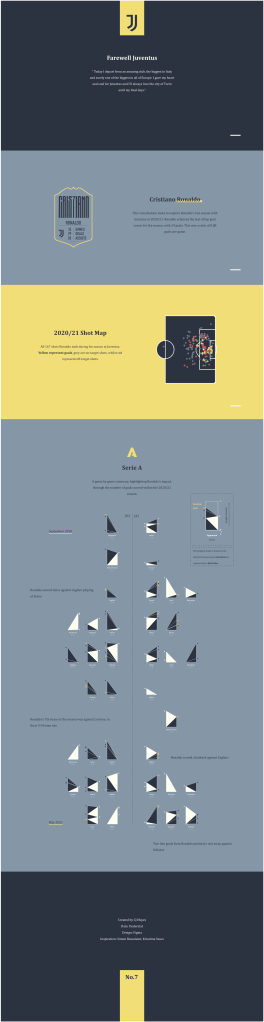
CJ Mayes – Cristiano Ronaldo
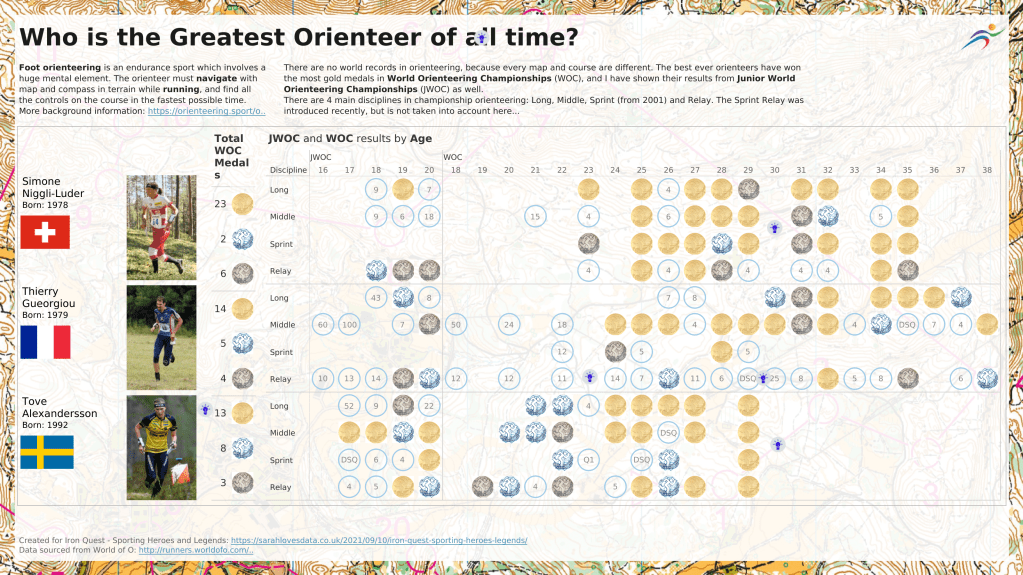
Dan Chissick – The Greatest Orienteers of All Time
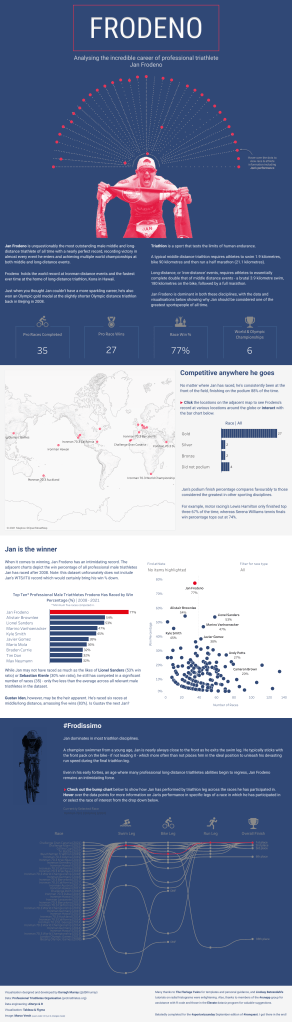
Darragh Murray – Jan Frodeno. Legend of Triathlon
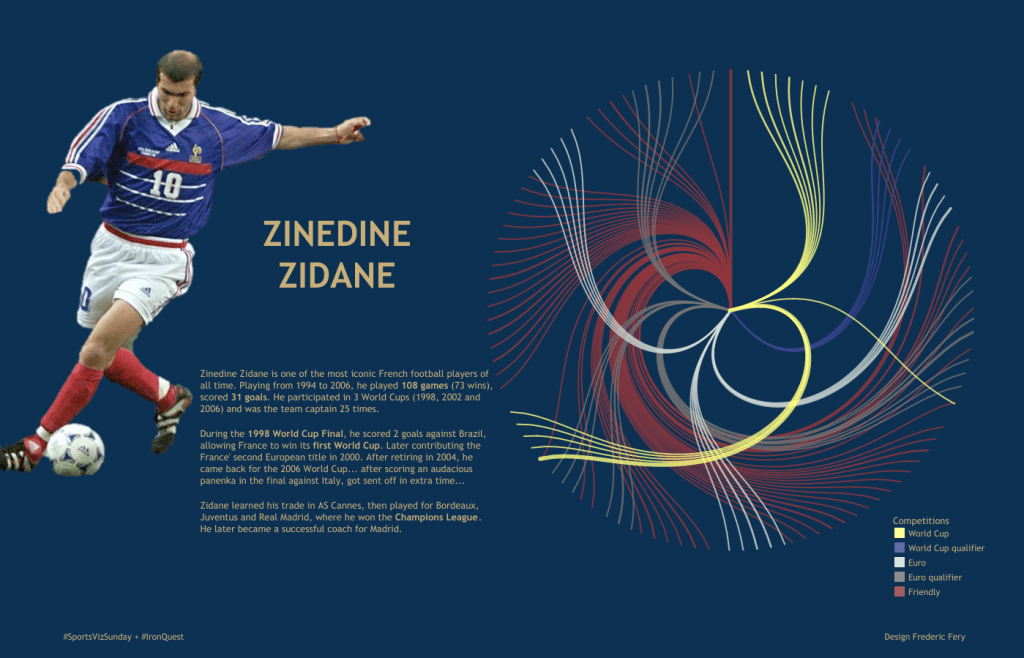
Frederic Fery – Zinedine Zidane | International Games
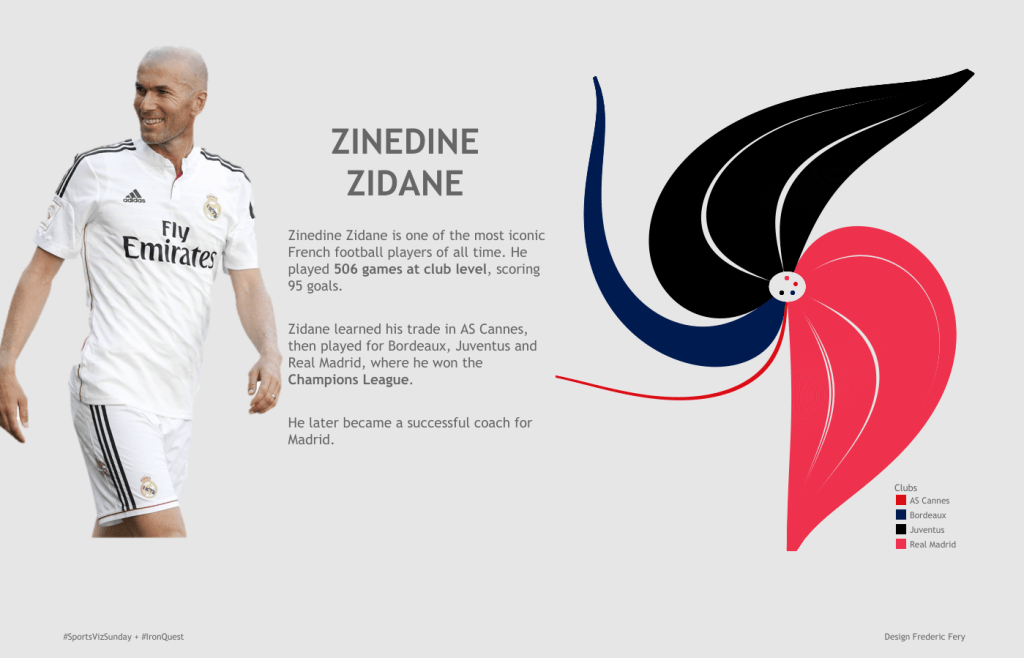
Frederic Fery – Zinedine Zidane | Club Games
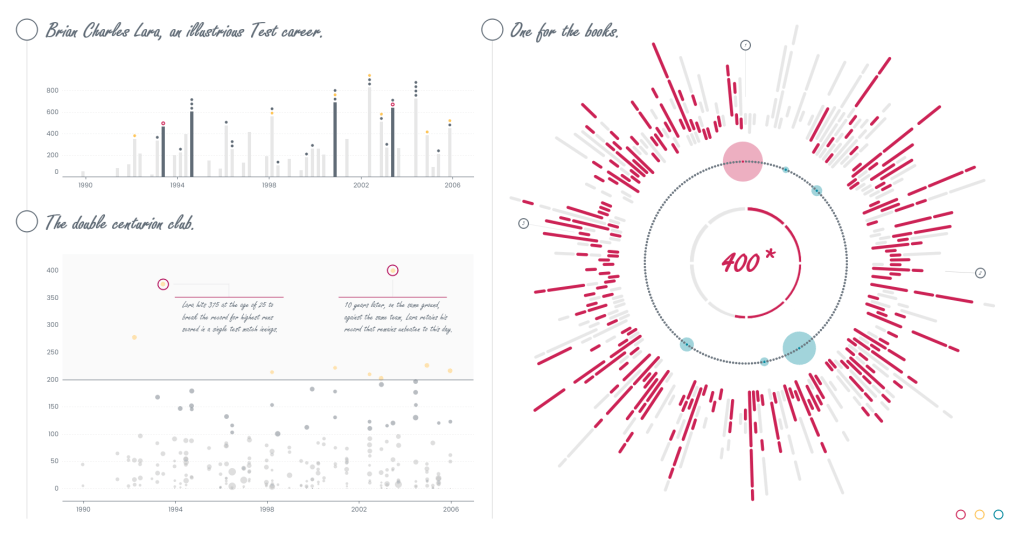
Fuad Ahmed – Brian Charles Lara
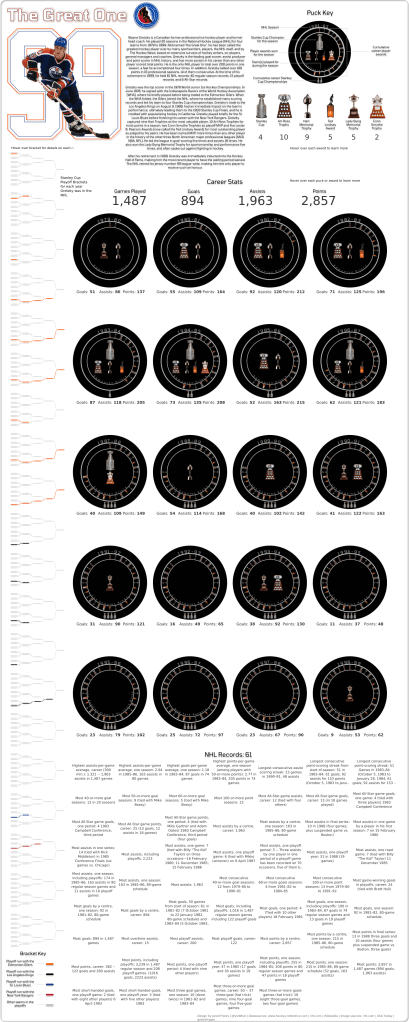
Jared Flores – The Great One
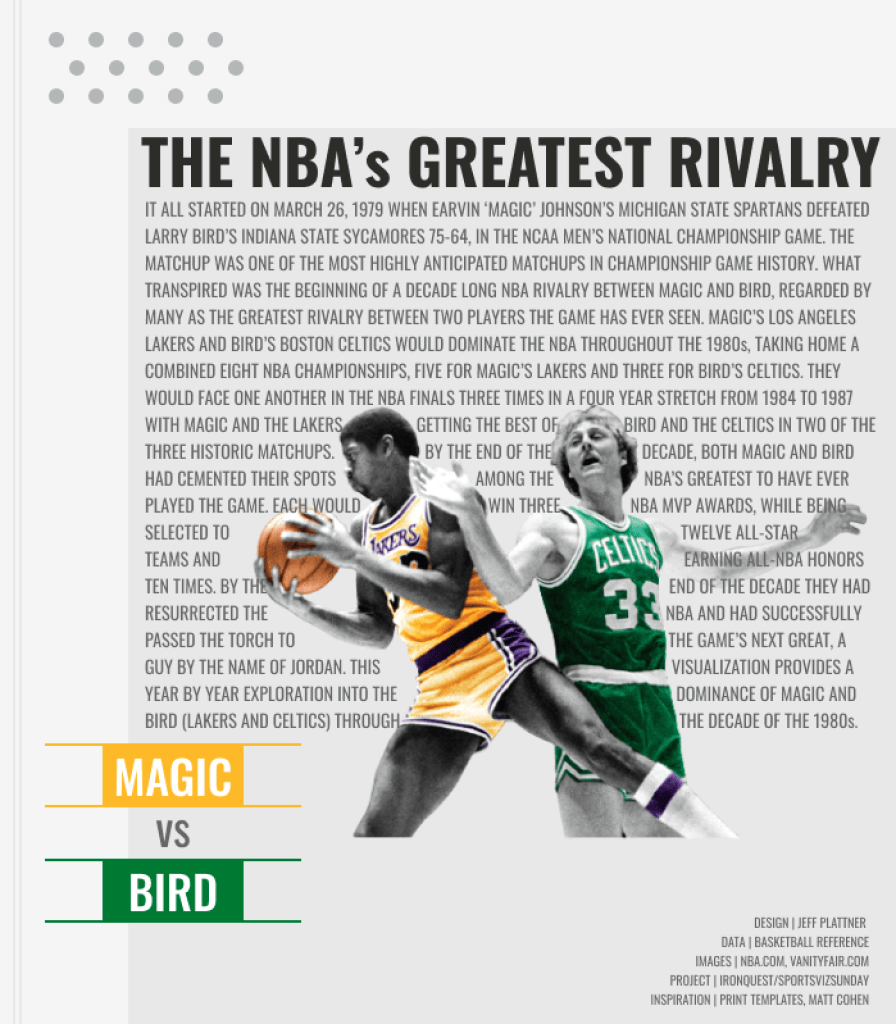
Jeff Plattner – Magic vs. Bird | The NBA’s Greatest Rivalry
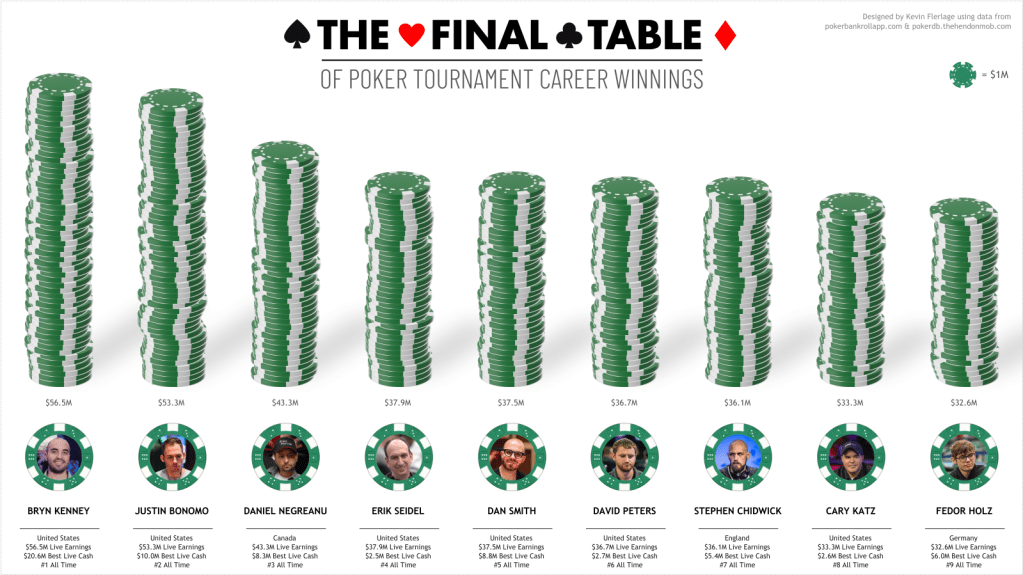
Kevin Flerlage – The Final Table of Poker Tournament Winnings
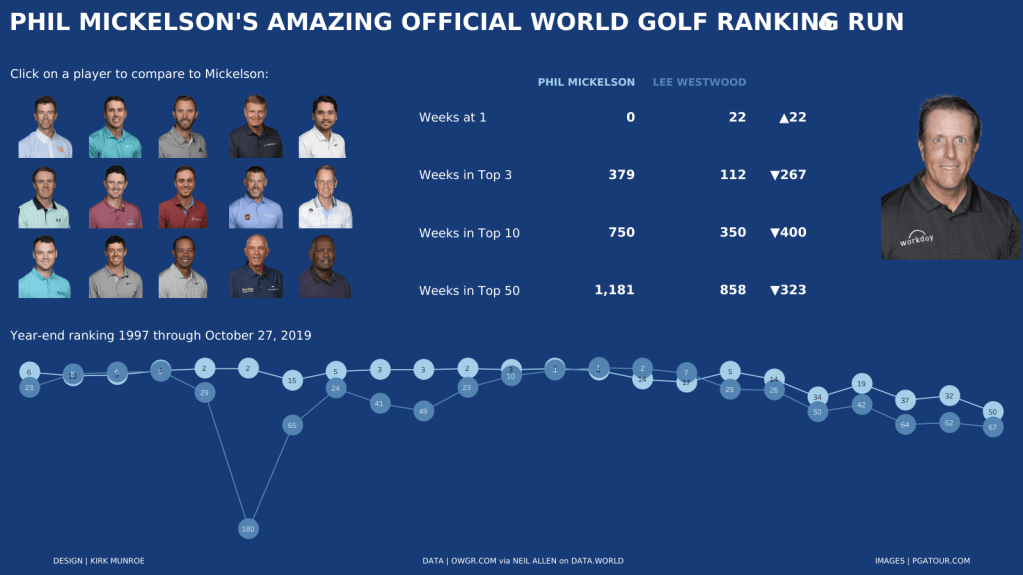
Kirk Munroe – Mickelson’s Amazing Official World Golf Ranking Run
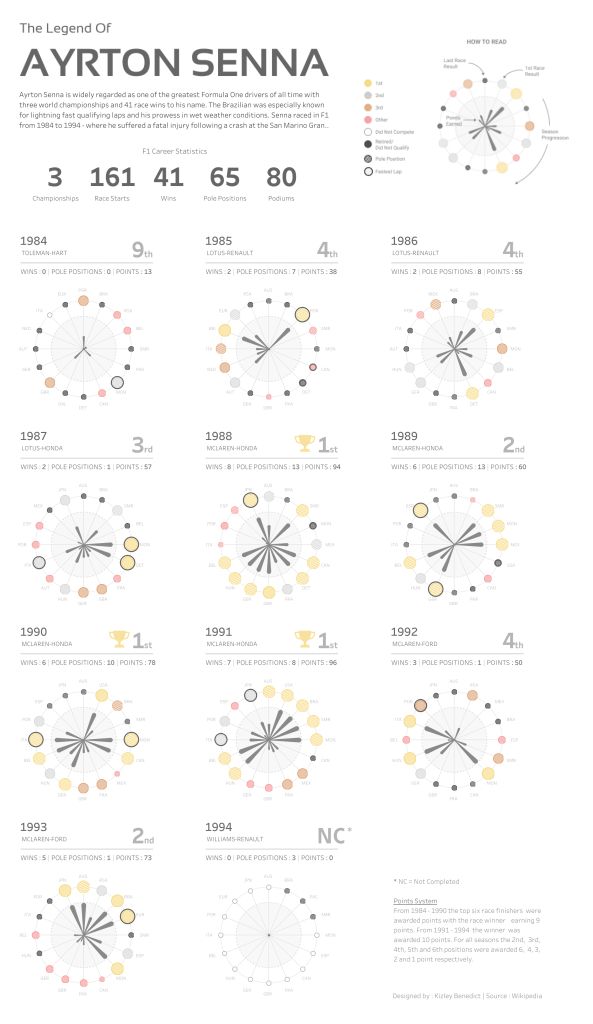
Kizley Benedict – The Legend of Ayrton Senna
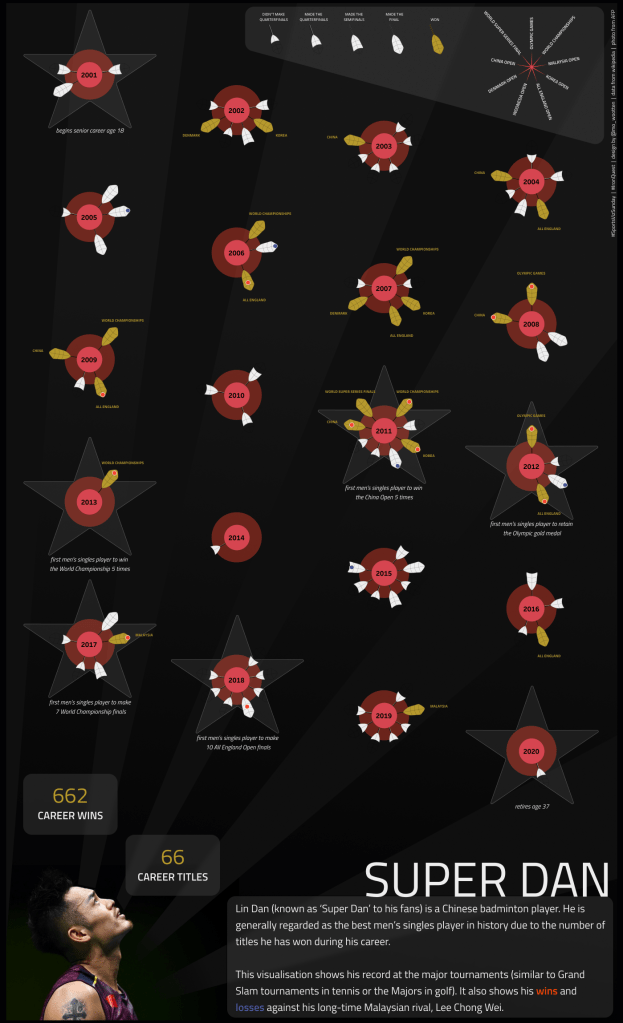
Mo Wootten – Super Dan
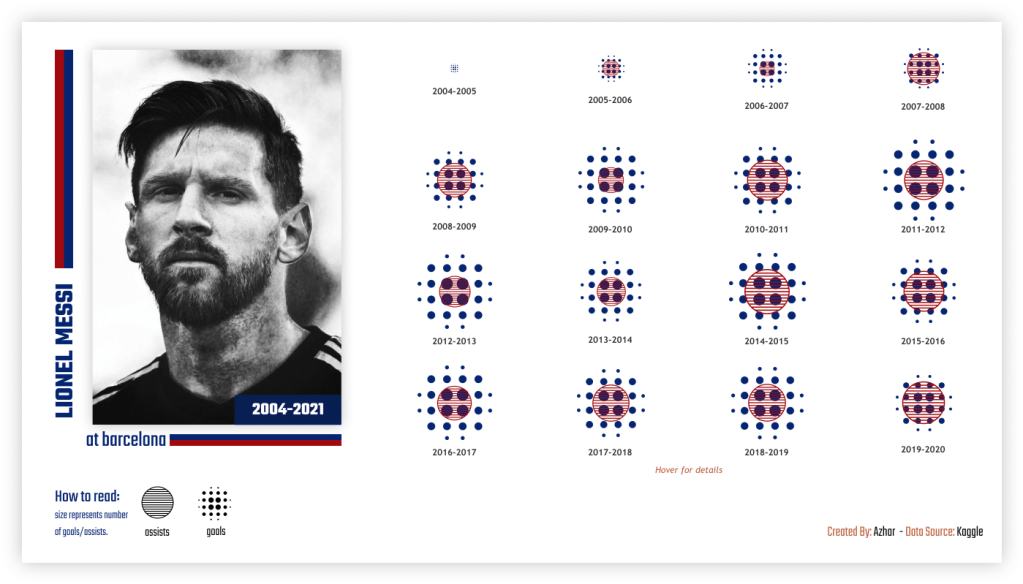
Muhammad Azhar – Lionel Messi at Barcelona
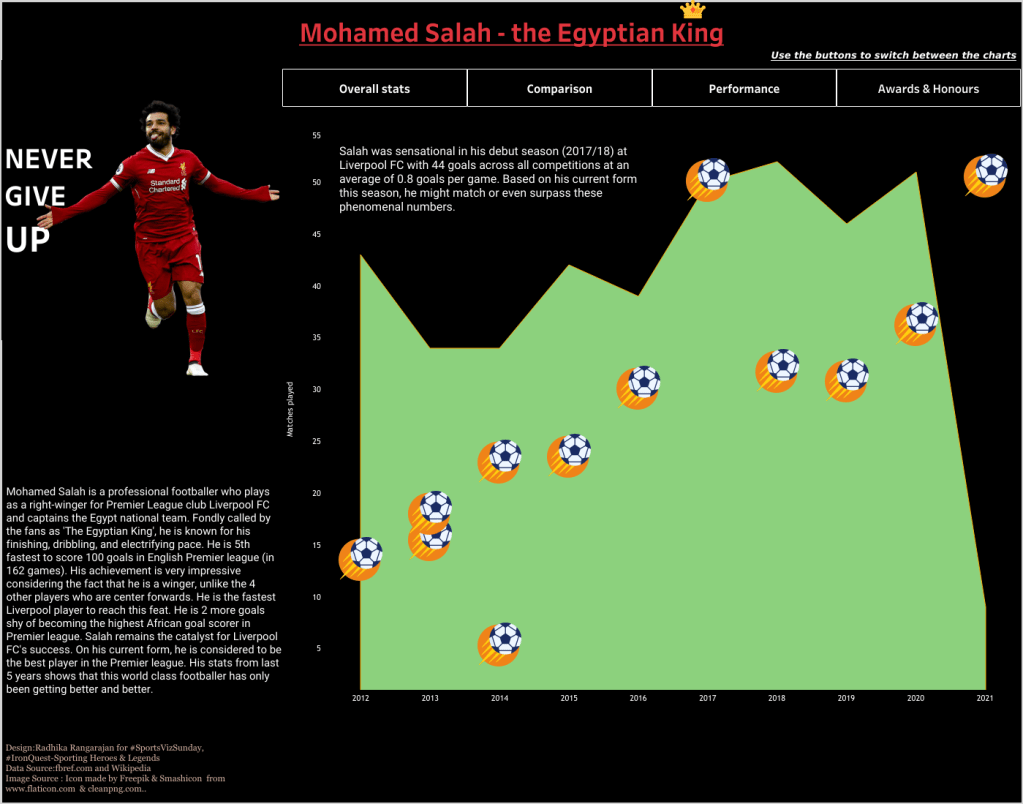
Radhika Rangarajan – Mohamed Salah- The Egyptian King
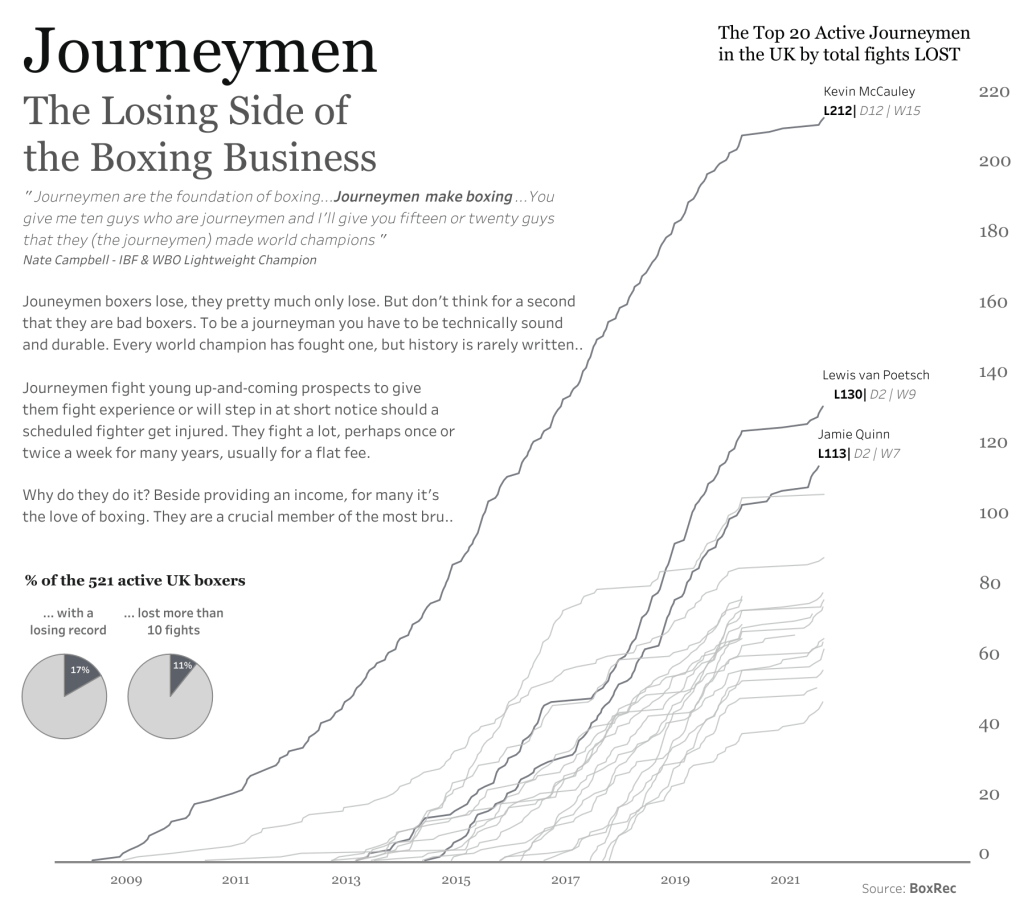
Robert Radburn – Journeymen : The Losing Side of the Boxing Business
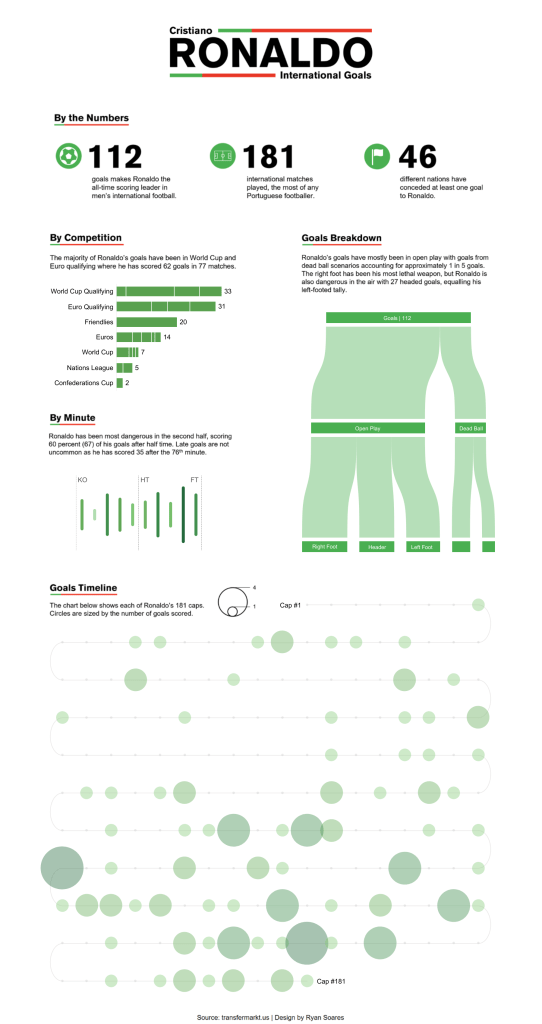
Ryan Soares – Cristiano Ronaldo International Goals
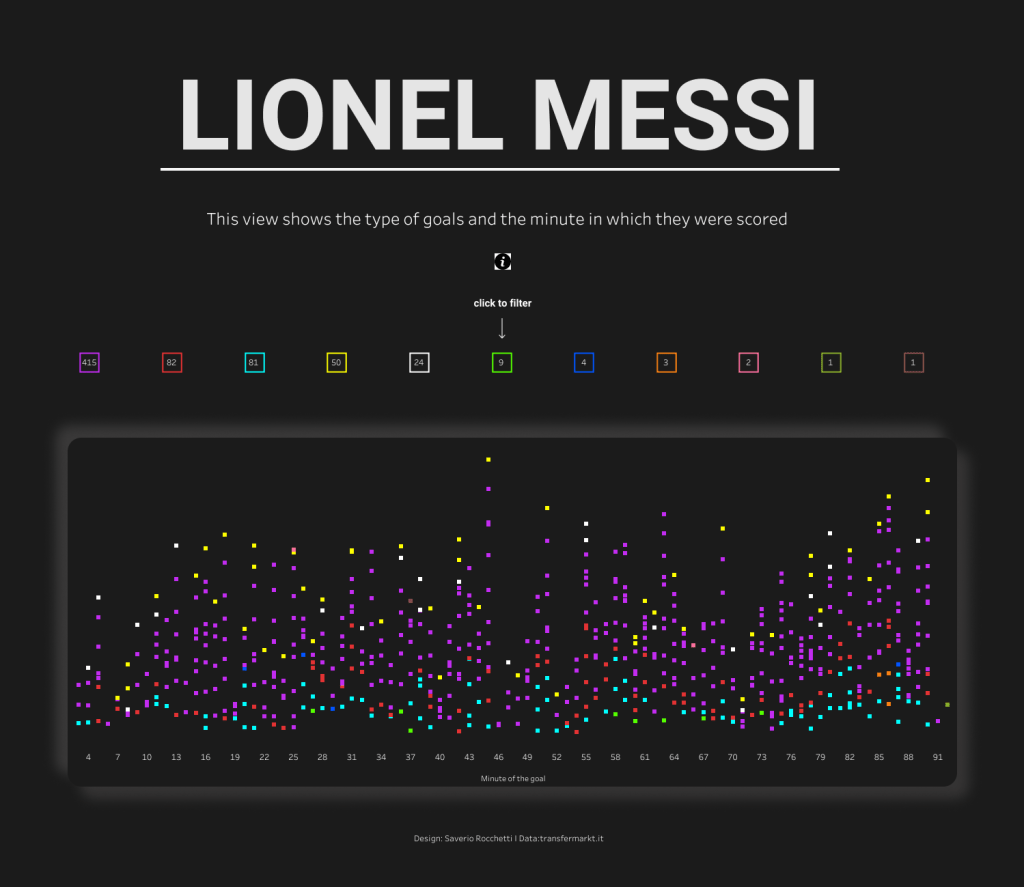
Saverio – Lionel Messi
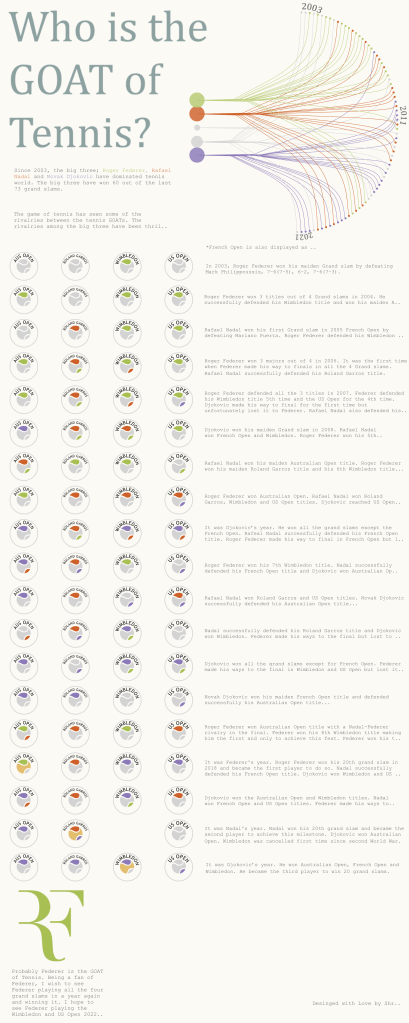
Shreyash Singh – The GOAT of Tennis
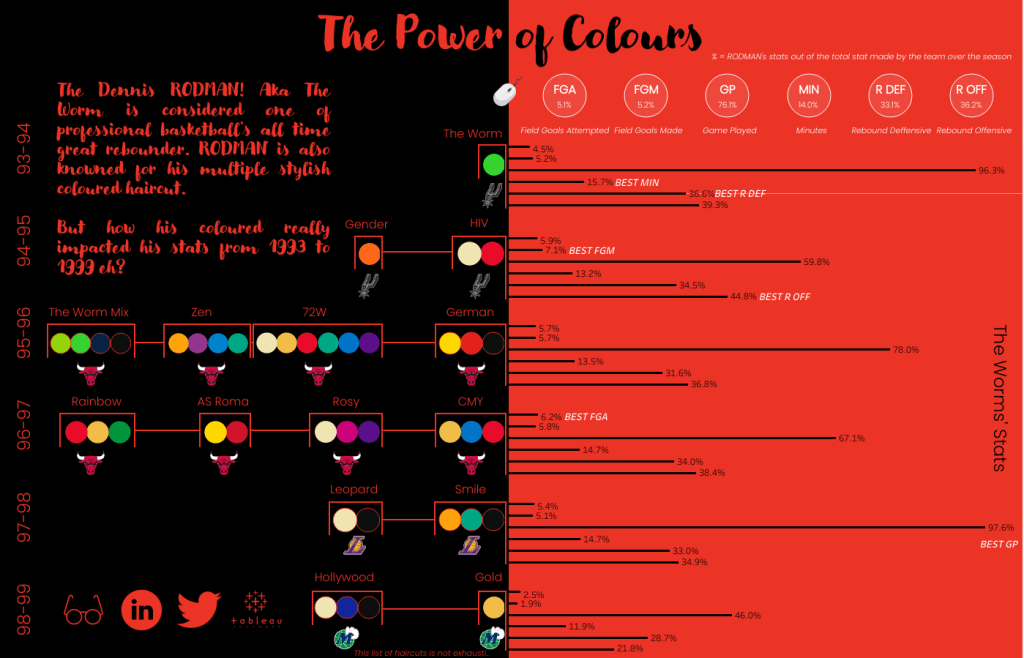
Simon Arira – The Power of Colours – Dennis RODMAN
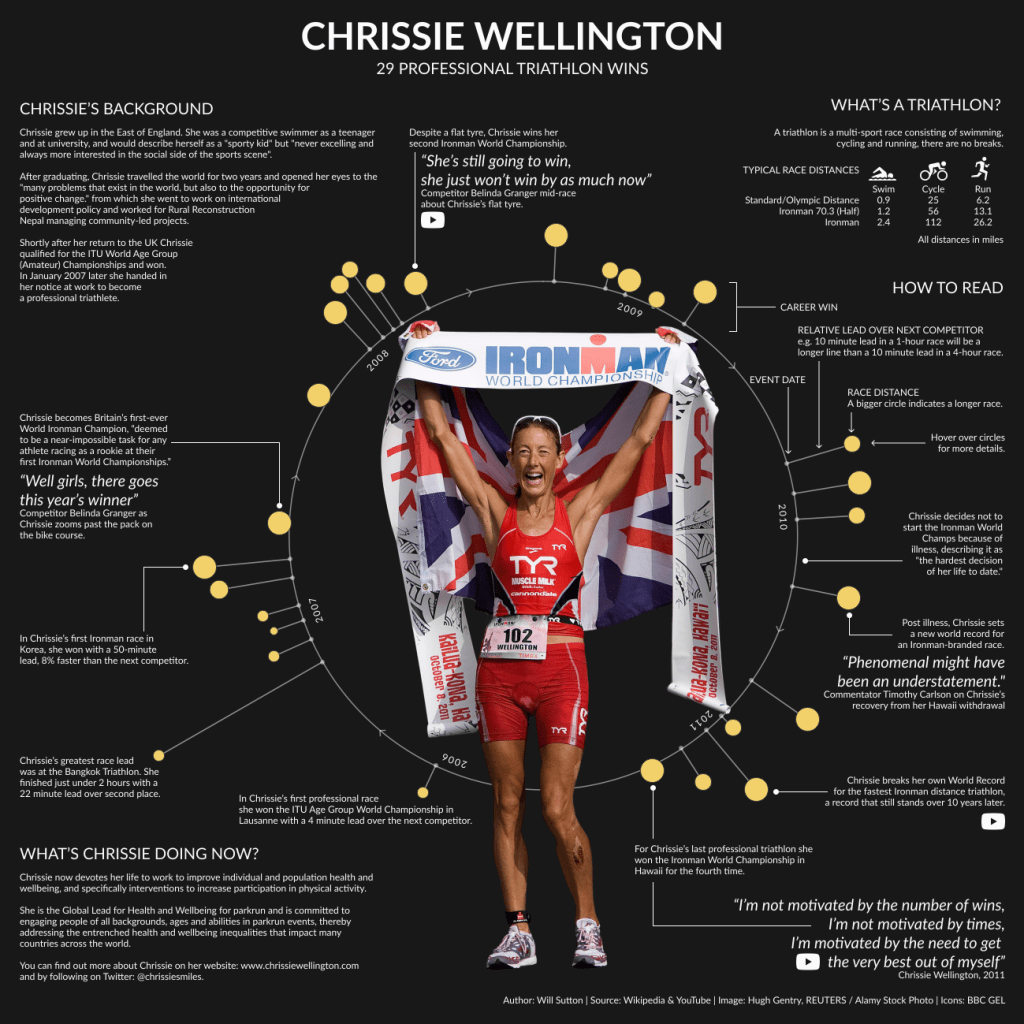
Will Sutton – Chrissie Wellington, 4 x Ironman World Champion
To stay up to date with all things #IronQuest, follow the hashtag #IronQuest on Twitter and LinkedIn, and check out the Iron Quest section on my blog for details of the latest projects.
Thanks for reading.
