Welcome back!
Iron Quest has been on a hiatus for the last few months. Thanks for sticking with us! We were sidetracked by all of the Iron Viz excitement and busy running the popular Iron Viz feedback initiative for a third year! Congratulations to all of those who entered.
We’re excited to return with a brand-new theme to see us through until Tableau Conference next month! We also have a shiny logo and branding for 2024!
New Here?
If you’re new to Iron Quest, first let me explain what this project is about!
Iron Quest is a monthly community-led data visualisation project which follows a similar format to the Tableau Iron Viz feeder competition. Founded in 2019, Iron Quest has received over 750 entries and remains one of the only community projects where participants ‘bring their own data’, similar to how you would for Iron Viz. Participants have around a calendar month to source a suitable data set and design, build and submit a data visualisation. Each submission should use a data set that somehow touches upon the chosen theme for that month and every viz should aim to showcase best practices & skills in design, storytelling & analysis; the judging criteria as Iron Viz.
If desired, participants can opt-in to receive feedback along the lines of design, storytelling and analysis from myself and other guest hosts. Once the submission period has closed we will review the visualisations submitted together and provide feedback to those who have requested it. There will also be a wrap-up blog post after every round.
Iron Quest aims to give individuals an opportunity to practice their data sourcing, data preparation and data visualization skills without the pressure that comes with participating in a competition like Iron Viz. With Iron Quest, there are no winners nor prizes, thus removing the competitive element.
The Theme
I’m excited to announce this month’s Iron Quest theme is Women!
In celebration of International Women’s Month (and International Women’s Day, celebrated on March 8th), we want to take this opportunity to recognise women through our data viz projects.
Your viz can focus on any aspect of the theme that you wish. You might choose to viz about inspirational women in entertainment, sports, business, inspiring writers, or even notable women from history. You could also visualise social issues that impact women such as the gender pay gap, healthcare, or female representation in politics.
Viz-spiration
For inspiration, consider the following vizzes that showcase women in various regards:
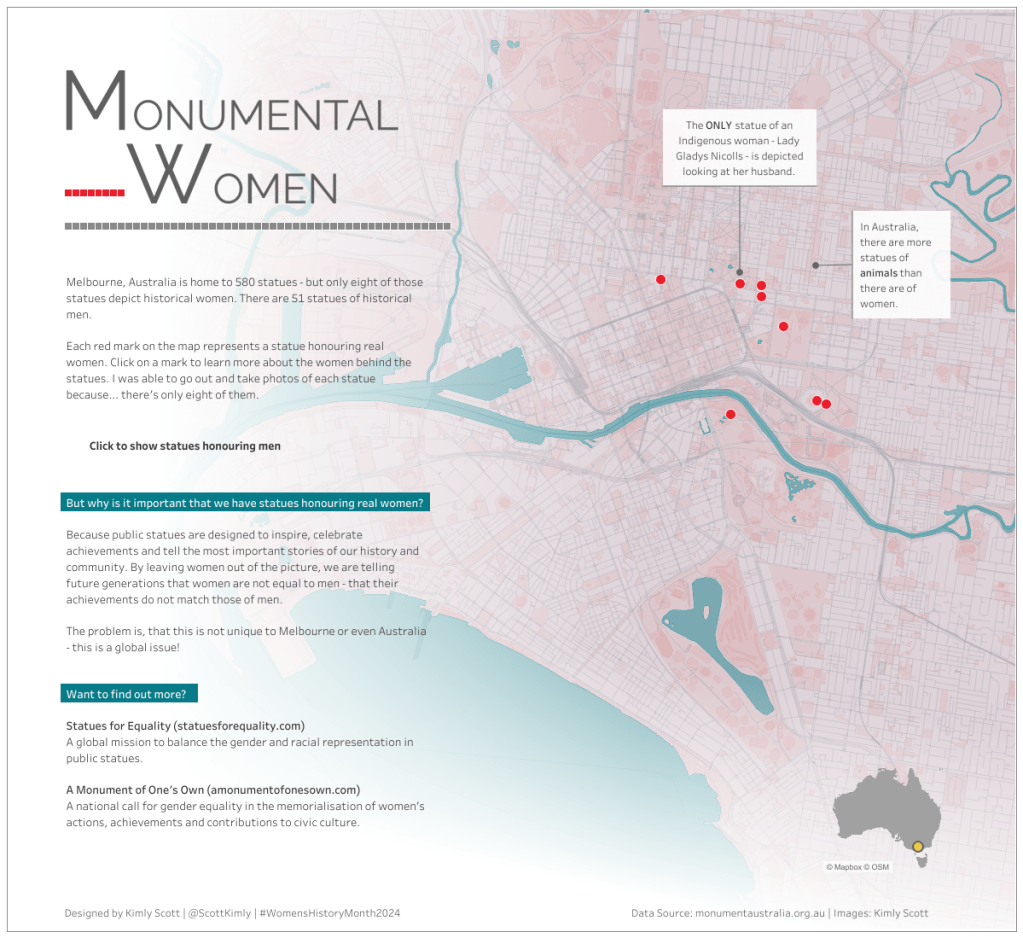
Monumental Women by Kimly Scott
In this viz, Kimly looks at data on the number of statues in Melbourne, Australia and how many honour women.
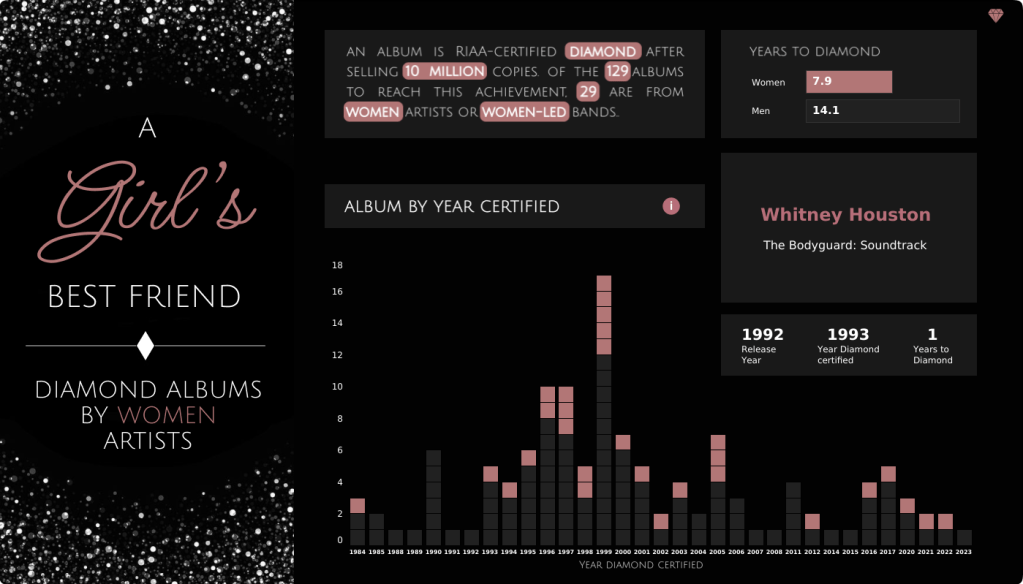
A Girl’s Best Friend by Alice McKnight
In this viz, Alice looks at data on diamond-certified albums by women music artists or women-led bands and long it took them to reach diamond status, compared to their male counterparts.
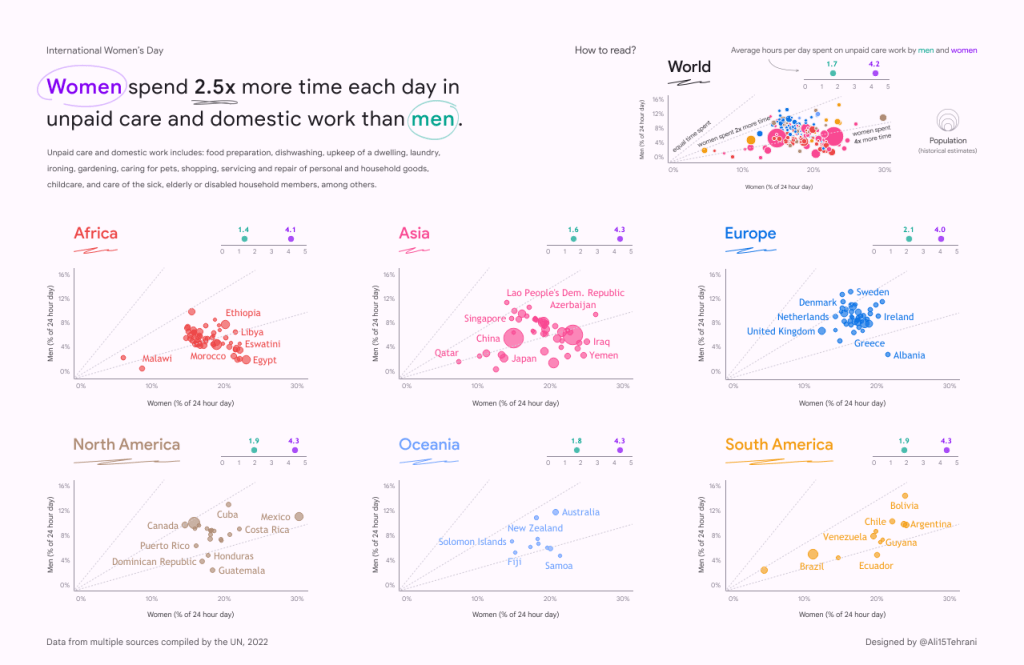
International Women’s Day by Ali Tehrani
In this viz, Ali looks at the amount of time women spend undertaking unpaid care and domestic work, by country, compared to their male counterparts.
Women in Parliament by Olushola Olojo
In this viz, Olushola looks at women’s parliamentary representation in European politics and how things have changed in the last 20 years.

Data Source Ideas
For data source inspiration, we encourage you to check out the following sites:
- Data is Plural – a weekly newsletter of useful/curious datasets, published by Jeremy Singer-Vine. There have been 309 editions to date. All of the datasets are saved to a Google sheet for easy reference.
- Flowing Data by Nathan Yau – a collection of datasets covering a broad range of topics
- Information is Beautiful – a collection of datasets compiled by the Information is Beautiful team covering a range of topics. They also have an additional collection of datasets used to drive the visualisations in the Beautiful News book.
- Public Data Sets – a list by Cole Nussbaumer Knaflic – a list of places to find free, publicly available datasets.
- Makeover Monday – a collection of over 350 data sets from previous Makeover Monday challenges.
How do I enter?
The process is simple:
- Source your data and build a viz aligned to the theme
- Upload your viz to Tableau Public or somewhere it can be openly viewed online.
- Fill in the submissions tracker (embedded at the bottom of this post) so we can keep track of who is participating. This step is essential if you want to request feedback or be credited in the wrap-up blog post.
- If you opted in for feedback in step 3, the co-hosts and I will provide some constructive feedback on your viz after the submission period closes.
Top Tips
- You can use any data set (assuming you have permission to share it publicly).
- Always remember to credit your data source/s on your viz.
- Refrain from using any images or logos on your viz unless you have permission to do so.
- Remember the Iron Viz judging criteria and try to focus on all three; Design, Storytelling and Analysis.
- Think outside the box!
Meet the Co-hosts
I’m excited to announce that I’ll be teaming up with two co-hosts this month! My co-hosts are both energetic voices in the community and frequently share inspirational vizzes on Tableau Public.

Dzifa Amexo
Dzifa is all about data, lifestyle, and laughs! As a co-leader of the BLK in Data Analytics (BLK in D&A), FinServ, and NYC Tableau User Groups she is dedicated to creating inclusive and welcoming communities where individuals can come together to learn and network.
She is a Tableau Public Ambassador (x 2) and now a Tableau Social Ambassador (x 2). By day, she works as a Data Technology Consultant at Keyrus. By night, she teaches Tableau for a women’s non-profit, Women’s Empowerment Institute (WEI).
Outside of Tableau and work, Dzifa enjoys all things Beyoncé, karaoke, travelling, volunteering, rollerblading, reading, and eating her way through the NYC food scene!

Emily De Padua
Emily is a Senior Data Analyst at Disney who loves people, learning and Tableau. ,
Originally a classical flute performance major from Rowan University, Emily was introduced to Tableau during her first Data Analytics role in 2016. For Emily, much of her learned Tableau skills can be credited to downloading, dissecting, and reverse engineering the inspirational works she discovered on Tableau Public.
In addition to serving as a Tableau Public Ambassador, Emily is a three-time Tableau Iron Viz Competition Runner-Up, placing 10th in the 2020 Iron Viz, 7th in the 2022 Iron Viz, and 8th in the 2024 Iron Viz.
When is the submission deadline?
The deadline for submissions is midnight PST on Sunday, April 14th 2024.
Please use the submission form below to submit your entry.
- Feedback will be provided (to those who request it) via a conversation recorded and posted to YouTube between the co-hosts and me in April.
- On the submissions form you can specify if you require feedback focused on the Iron Viz scoring criteria (design, storytelling and analysis) or more general data viz feedback.
- Please note, that if we receive a large number of feedback requests (more than we can cover in two hours), we’ll prioritise those from Tableau beginners or those entering #IronQuest for the first time.
Continue the conversation and connect with other participants by following the #IronQuest hashtag on Twitter (X) and LinkedIn.
Look out for the feedback video and recap blog post after we complete this challenge!
Thanks for reading and we look forward to seeing your entry!
