
Last week, over 250 Tableau Community members from over 30 countries globally gathered in Berlin for the European Tableau community event of the year; VizIt Berlin! I had the privilege of being on the organising team for this event and together with Tableau and InterWorks (our main sponsors), we spent most of the year bringing this event to life. Now that it’s over (and we can breathe again!), I thought I would share some reflections and highlights of an eventful two days.
Background
The idea for VizIt was born in 2022 when community members in Europe expressed the desire for a Tableau Conference; similar to the ones Tableau used to host pre-pandemic/Salesforce acquisition. As it became apparent we wouldn’t have a Tableau Conference Europe in 2022, we worked with the Tableau Community team in London to host our own, free-to-attend, small-scale event in the London Salesforce office in November 2022. As space was limited, this event was exclusively for Tableau Community leaders and sadly not the community at large. With over 100 attendees and two days of content, VizIt London was a success! However, we knew we wanted to do something bigger, better and more inclusive this year.
Together with Annabelle Rincon, Heide Kalbe, Tore Levinsen, and the EMEA Tableau Community team, we brainstormed what a larger VizIt event could look like in 2023. The main challenges we faced were sponsorship and event space. We needed a sponsor who could secure a venue for us and handle the financial side of things; something we would not be able to do as individuals. Thankfully, InterWorks offered to help us and had some team members conveniently located in Berlin; our city of choice! From there we were able to secure a suitable venue and reach out to our community for speakers. Thankfully, we were inundated with speaker submissions. So much so, our agenda was packed to the brim with content and featured over 40 speakers; predominately from the community but we also had speakers from Tableau and our sponsors; InterWorks, Snowflake, OneData, FiveTran, Wiiisdom and Apps for Tableau.
VizIt Berlin 2023
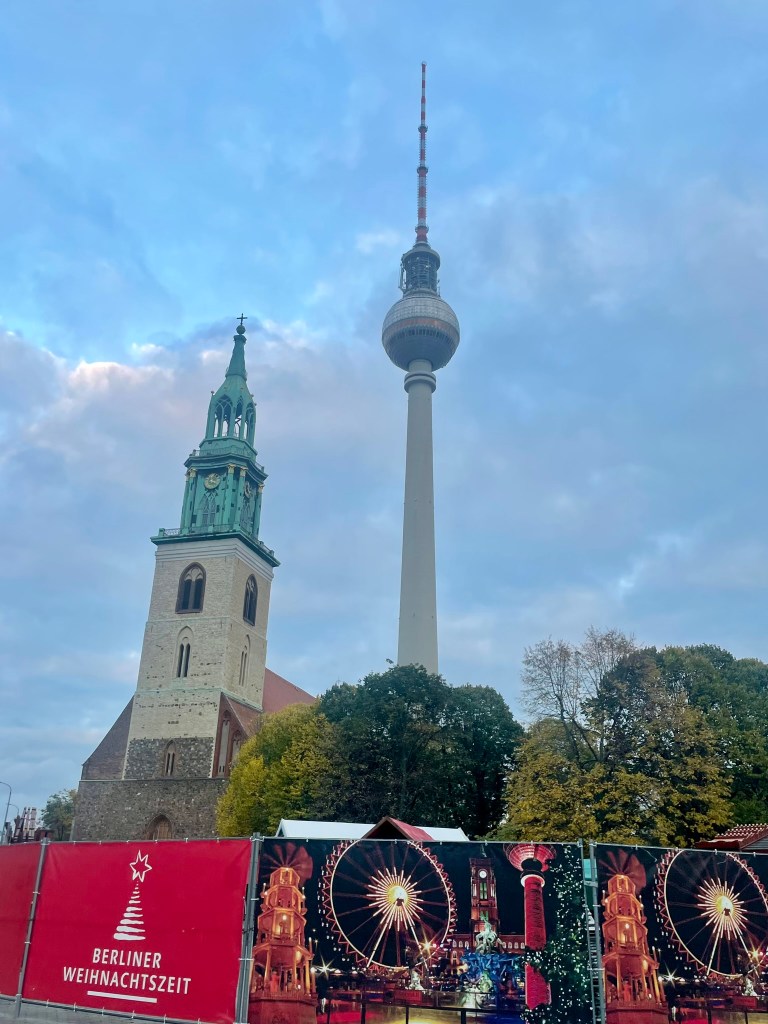
This year, VizIt was held at the Maritim proArte Hotel in Berlin city centre. We secured a capacity of 250 people with space for a main keynote theatre, plus two smaller breakout rooms. This enabled us to run three parallel speaker tracks, as well as host everyone in the main theatre for the keynote talks. We also secured a ‘expo hall’ room for sponsor booths and everyone’s favourite Tableau photo booth!
To ensure VizIt was accessible, tickets were completely free. We recognise that conference ticket prices can be expensive and often prevent those who can’t get company funding (or even those who can) from attending. With VizIt, the only costs incurred by attendees were those associated with travel to/from the city. Unfortunately, this also meant that tickets sold out quickly! We had a long waiting list and despite our best efforts, we still had several people who registered for the event but didn’t show up. Thankfully, we oversold tickets so despite our drop-out rate, we still reached capacity.
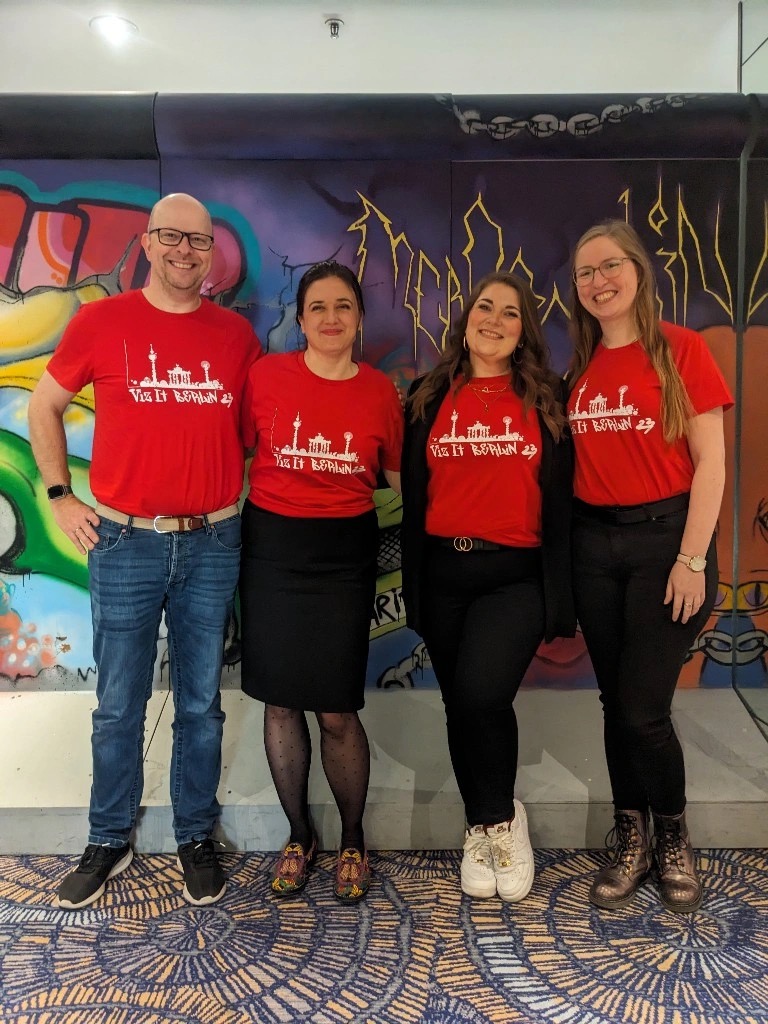
As leaders, it was important to us that VizIt retained its independent, community-led feel, despite being sponsored by Tableau and InterWorks, amongst others. As such, we worked with Julia Buechting to design unique VizIt branding. Keeping with the Berlin theme, Julia designed a viz to depict the Berlin skyline – in Tableau, with graffiti-style writing to match! We used this design on the VizIt t-shirts, as well as on the speaker slides and other assets throughout the event:

Reflections
I personally really enjoyed VizIt Berlin and, based on the feedback we’ve received, others did too. It was refreshing to attend a ‘Tableau’ event that wasn’t flooded with Salesforce branding; whether that be blue clouds or furry characters. While there’s nothing wrong with these things, VizIt felt closer to the Tableau events of the past, where the focus was more on the content and less on the flashy marketing. I can honestly say that despite having sponsors supporting the event, I didn’t once feel that I was being sold anything. For the most part, speakers were freely sharing their knowledge without expecting anything in return.
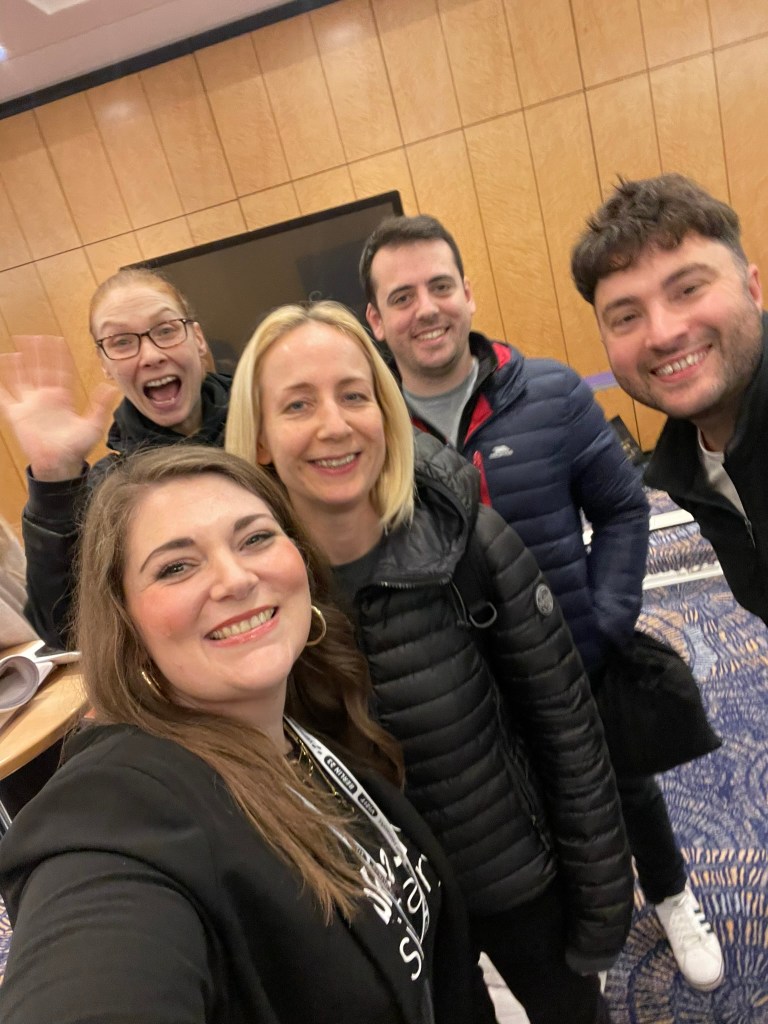
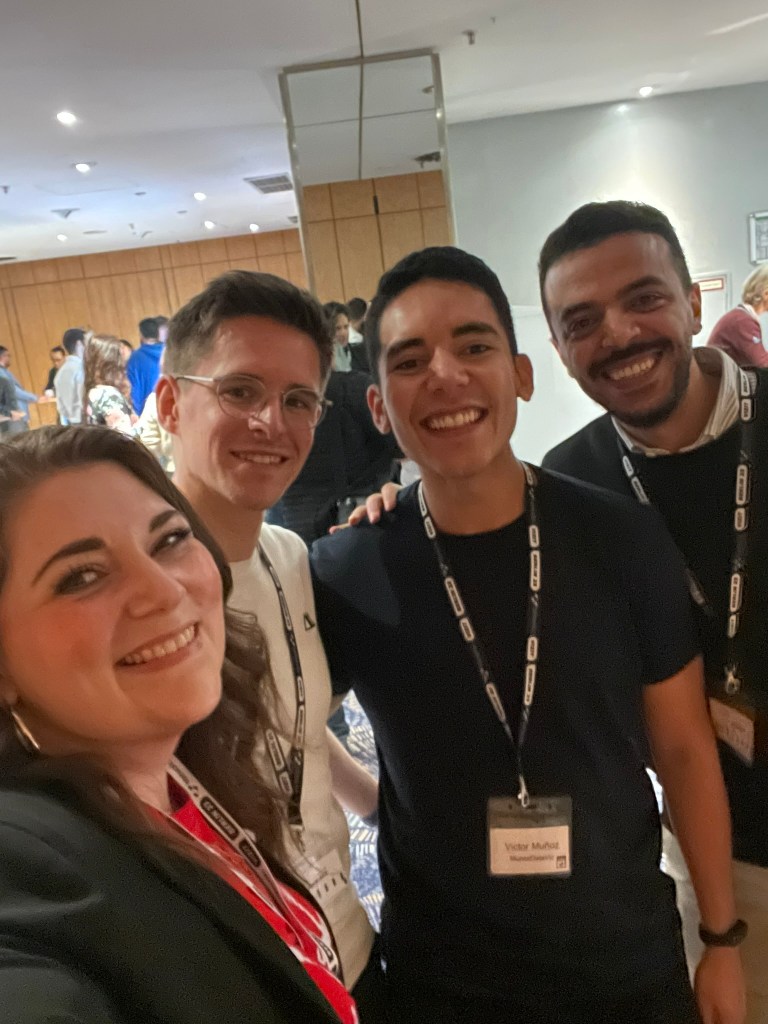
There was a friendly, welcoming atmosphere at the event, too. For many people in attendance, it was their first-ever Tableau event. Unlike large-scale Tableau Conferences, VizIt was small enough that everyone could freely chat to each other, without being overwhelmed by large groups of people. In fact, the venue and scheduling allowed for plenty of “mingling” time during breaks. It had a wholesome feel to it, where most people were attending to learn from others (or share their knowledge via talks), catch up with old friends or colleagues, and make new connections in the process. For me, it was a great opportunity to connect with some of my new colleagues from JLL, particularly those located outside of the UK.
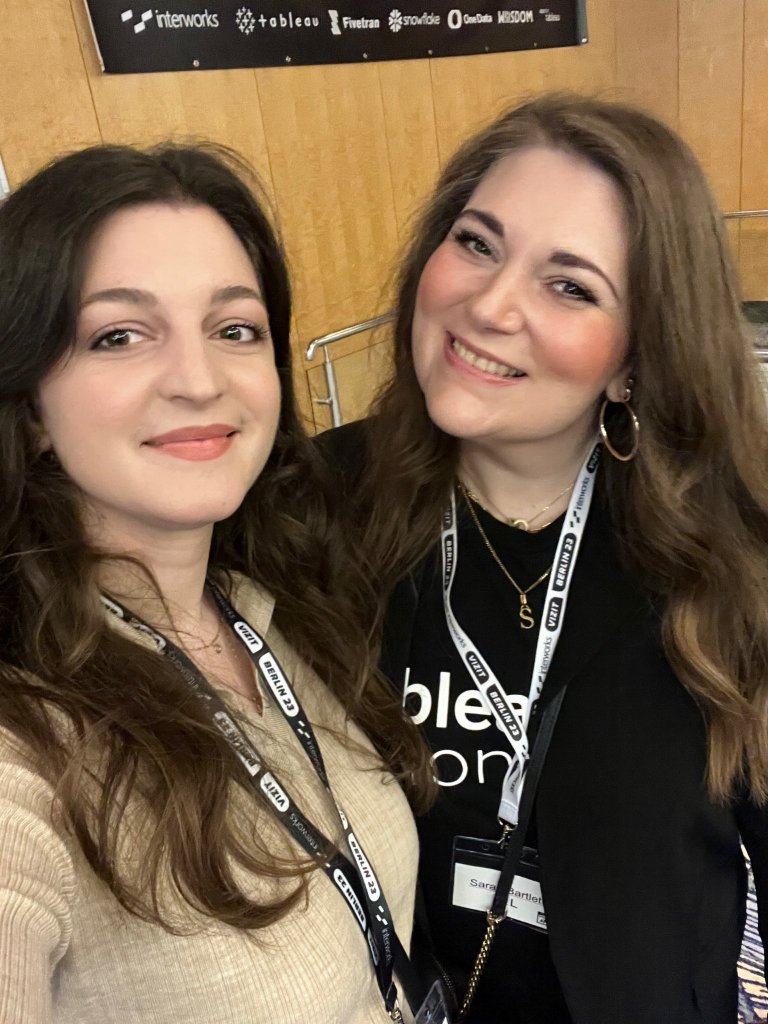
For many in attendance, a Tableau Conference in the US is completely off the cards; whether for financial, logistical or other reasons. As a result, there was a feeling of gratitude from attendees. Everyone was grateful for the opportunity to attend an in-person Tableau “conference” and meet others in person that they otherwise wouldn’t have had the opportunity to do so. Even for myself, I had the opportunity to meet people at VizIt that I’ve only ever interacted with online, in some cases for years before meeting them last week. Although hundreds of local TUGs around the world bring people together in person, VizIt was on a completely different scale. VizIt also allowed me the opportunity to connect with people like Paul Ekeland; Product Management Director at Tableau, to discuss the Tableau vision for the future – something that would be near-impossible to coordinate at a larger Tableau Conference event.
Highlights
With such a packed agenda, I sadly couldn’t attend all of the sessions I would have liked to. As a result, my highlights are limited to those sessions that I attended. I know there were plenty of amazing sessions that I inevitably missed and I’ve seen others have written about them on LinkedIn. I hope the speakers will repeat these sessions at TUGs soon so we can all enjoy and learn from this valuable content (hint hint!).
That said, here are a few of my highlights:
Data+Women City Walk and Pre-Game Event
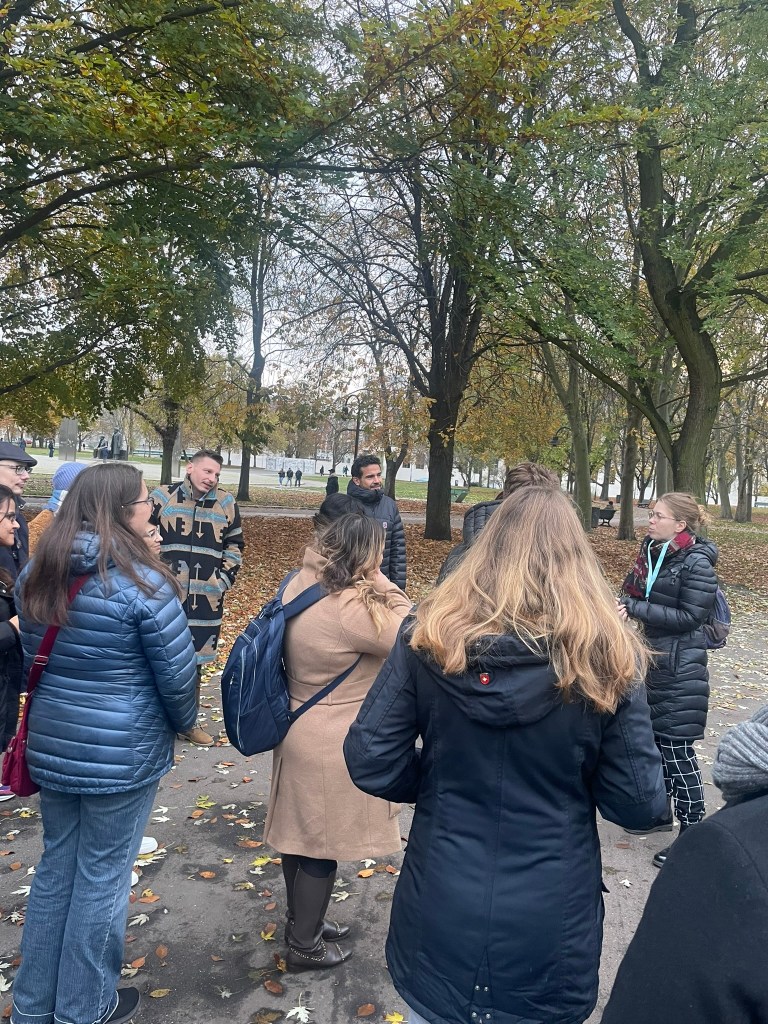
In true Tableau Conference style, Heidi, Annabelle and Julia organised a Data+Women Pre-Game event on Sunday evening which started with a ‘Women of Berlin’ guided city walk, and concluded with a drinks reception.
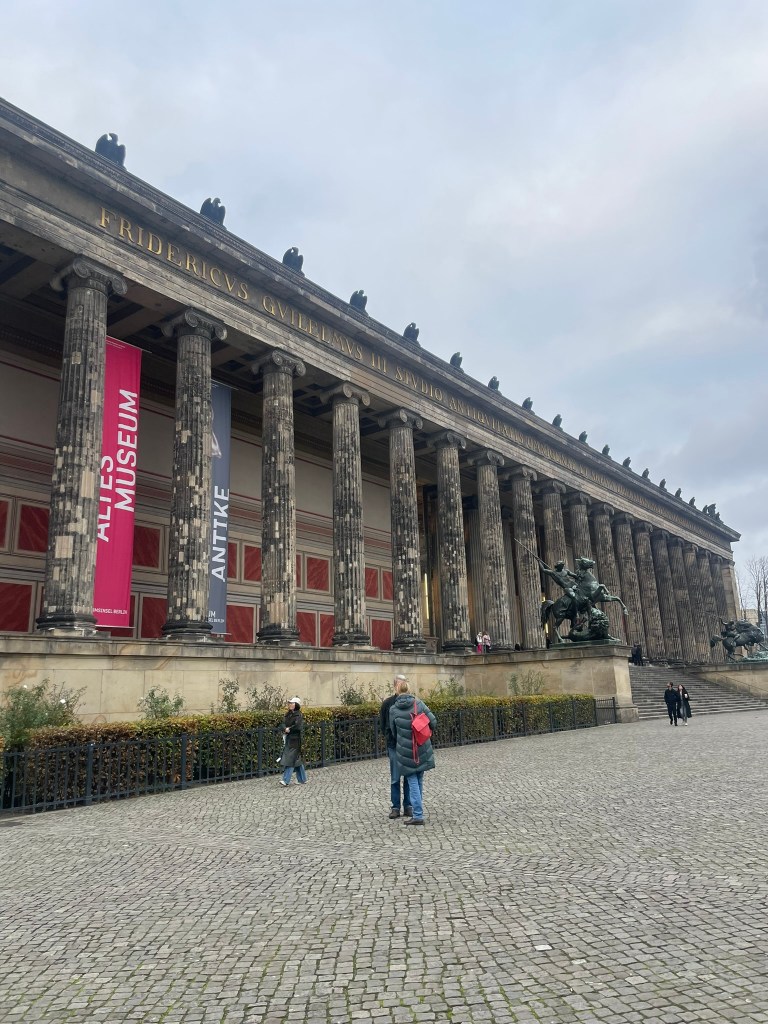
The walk was a fantastic way to explore more of the city and learn about its history and in particular, its most notable women. Our tour guide was highly knowledgeable and shared many interesting stories and historical facts.
After the walk, we gathered in a local bar for more networking. This was a great opportunity to connect with other attendees and get to know everyone before the conference kick-off on Monday.
Andy Cotgreave – “It Depends” Keynote
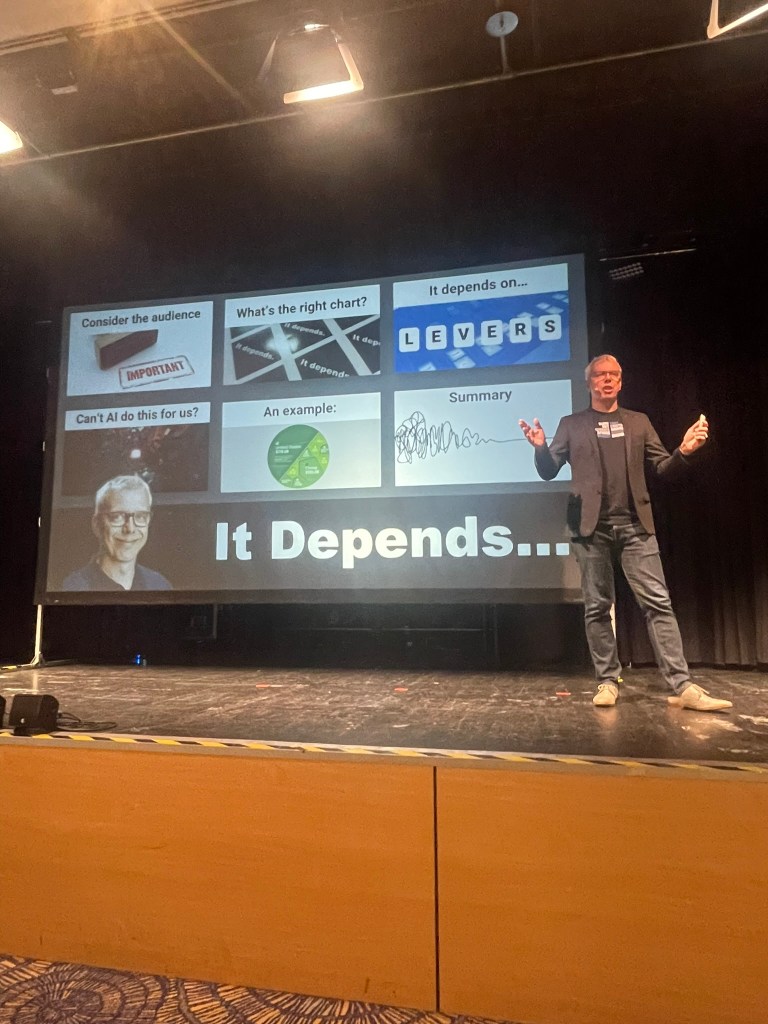
VizIt Berlin opened with a thought-provoking keynote from Tableau’s Andy Cotgreave entitled “It Depends”. In this talk, Andy discussed how our approach to data visualisation will depend on many factors; there’s not necessarily any right or wrong approach. A lot will depend on our audience, the medium we are using and the desired action we are seeking.
He also introduced the LEVERS model, designed to cover the creative tensions, or “levers” chart producers can use to enlighten, and not bamboozle, their audience. You can read more about the LEVERS here.
Klaus Schulte – Data Mapping Hack
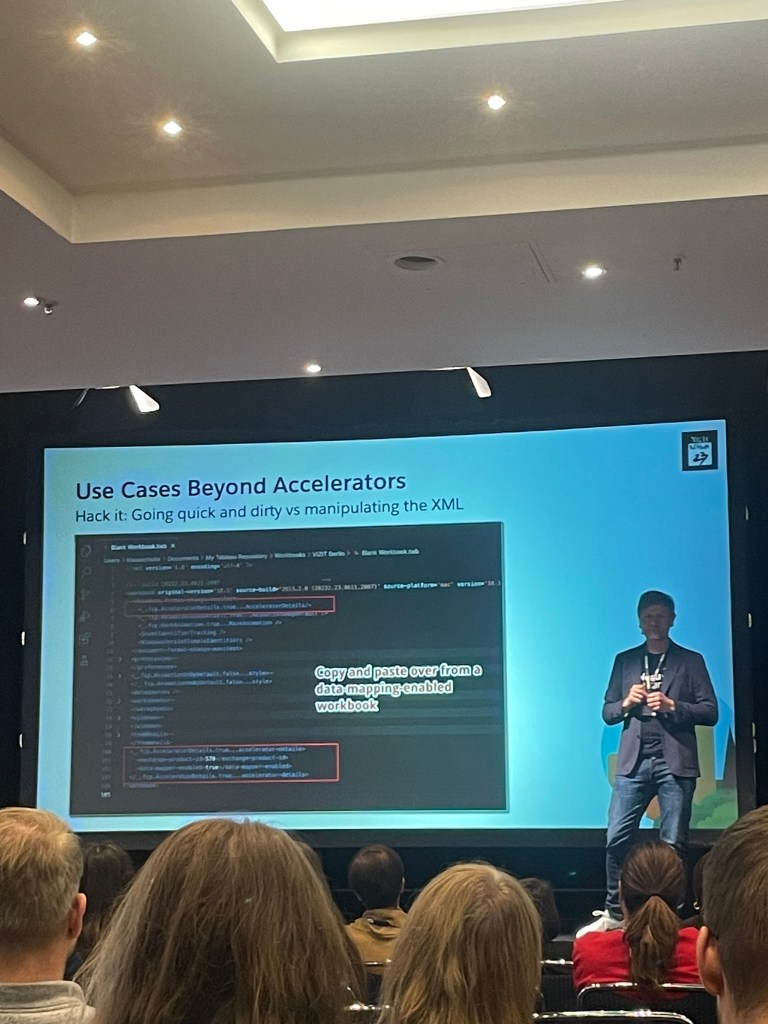
Tableau Visionary, Klaus Schulte, presented an overview of the Tableau Data Mapping feature. This feature is available in workbooks that have been downloaded from the Tableau Exchange. The idea is, you can use the data mapping feature to easily replace the Accelerator data source with one of your own, and then use the Accelerator as a template for a new dashboard.
I remember getting excited when Francois Ajenstat presented this feature to London TUG in February 2023, naively thinking this would apply to any workbooks and would therefore revolutionise the way many organisations use dashboard templates. Sadly, I soon discovered that this is not a native Tableau feature and is only available on Accelerator workbooks. However, Klaus has discovered a way to leverage this feature on any workbook! The approach is a bit hacky (like many things in Tableau) but it works!
To learn more about this trick, read Klaus’s blog post here.
Tableau Ask Me Anything
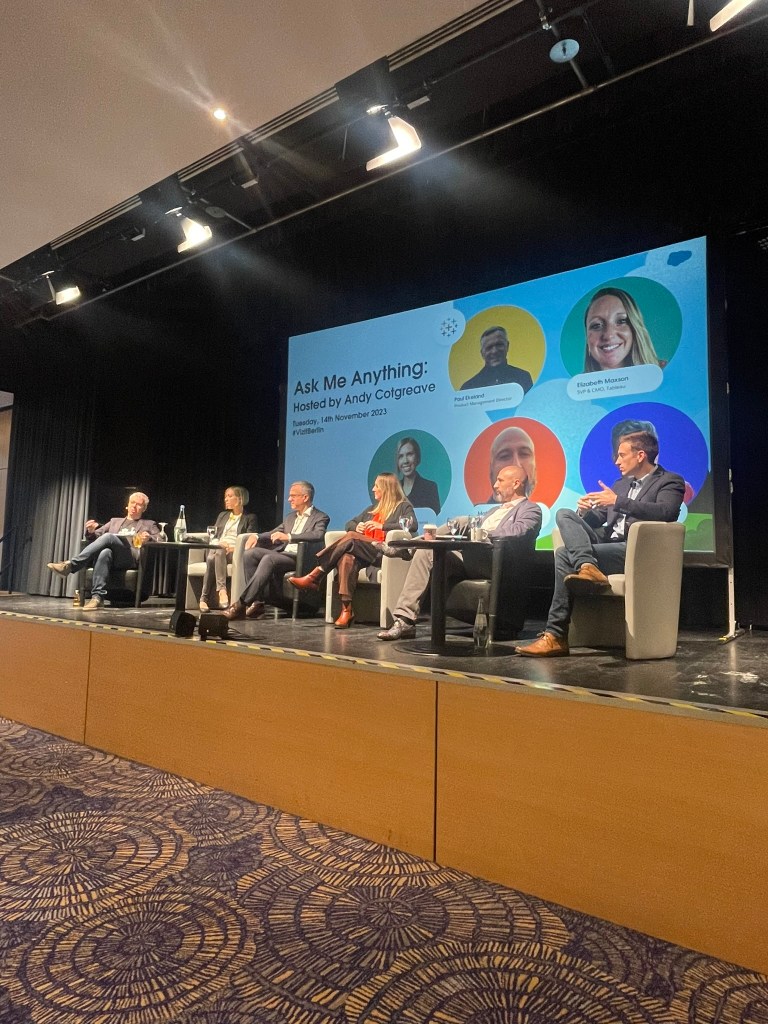
For the opening keynote on day 2, Andy Cotgreave hosted a Tableau ‘Ask Me Anything‘ panel discussion, similar to the ‘True to the Core’ session that took place at TC23.
Andy was joined by a group of leaders from Tableau to answer questions from the audience. The panel included:
- Kelly Genton – Director (Tableau Community)
- Matthew Miller – Senior Director, Product Management
- Paul Ekeland – Director, Product Management
- Elizabeth Maxon – Chief Marketing Officer (Tableau)
- Scott Smith – Product Manager, Tableau Cloud
These types of sessions are rare so it was an honour to be able to host a session like this at VizIt, allowing the European audience an opportunity to ask any burning questions they had.
Over the hour, the panel took multiple questions from the audience, including:
- Will TC Europe be coming back?
- Will the core authoring UI be updated to make new features more accessible?
- How can we get better usage data to understand how people are using our dashboards?
- What does the future look like for analysts with all of the new AI-powered features?
- How long do ideas posted to the Tableau Forums stay in the “under consideration” phase before being added to the product?
All in all, it was an insightful session and led to a lot of engagement from the audience.
Judit Bekker – A glimpse into my metadata: The grind between idea and implementation
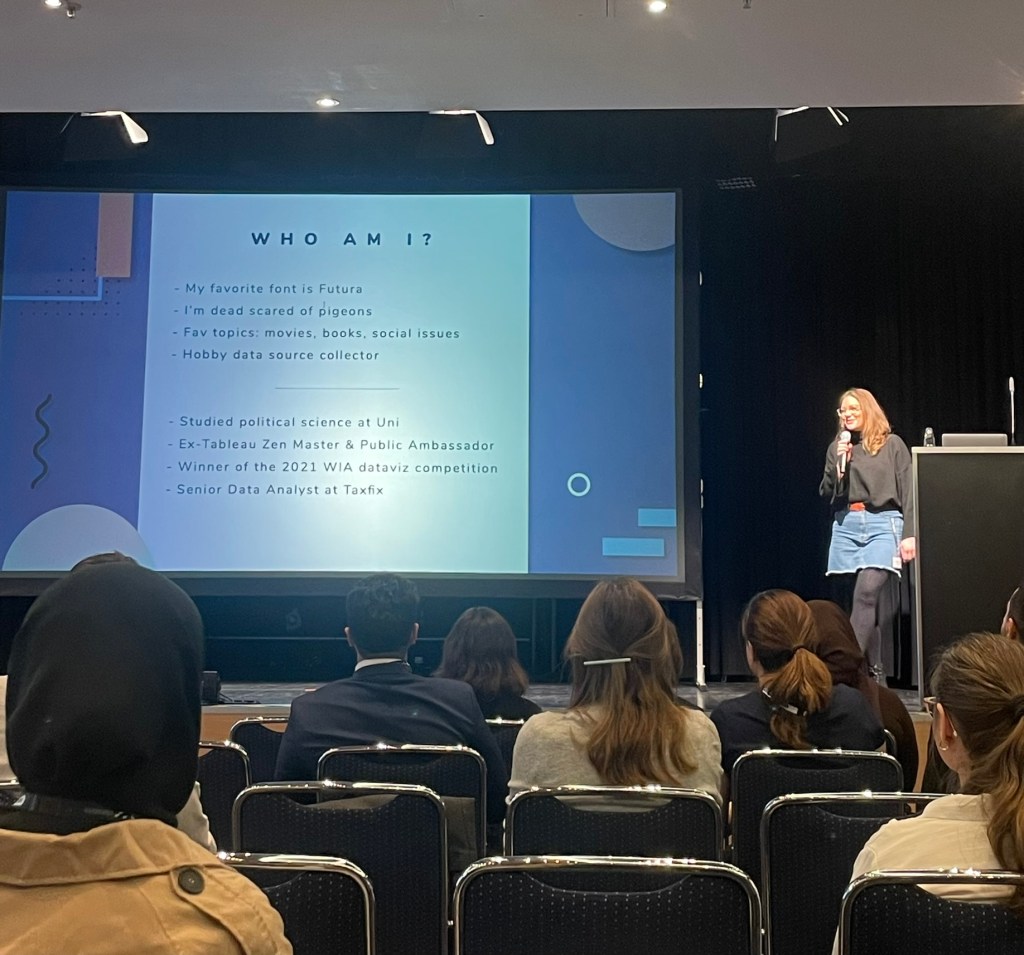
Judit is a well-known name in the Tableau Community, famous for her impeccable design skills and ability to craft beautiful data visualisations. For many of her vizzes, she has collected the data herself, often in a painstaking way!
In this talk, she shed some light on her data collection process. For instance, she once sat for 50 hours watching people drink coffee for her Twin Peaks viz! I found it fascinating to hear more from Judit about her approach to viz design and what drives her. This talk left me inspired to go and collect more datasets of my own, too!
Big Little Tips Live – Ivett Kovács & Ludovic Tavenier
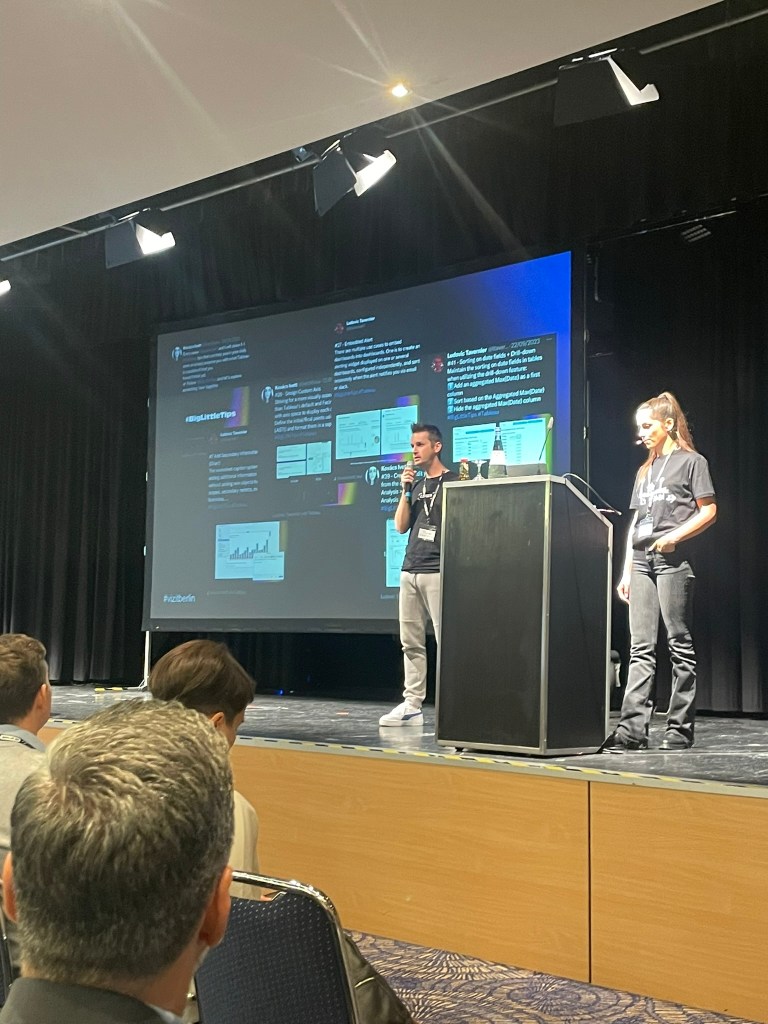
Throughout 2023, Ivett Kovács and Ludovic Tavenier have hosted a Tableau tips series on Twitter/X entitled #BigLittleTips. The tips they share are designed to help you in your daily work or simply surprise you with what Tableau is capable of. For VizIt, they presented some of their favourite tips live on stage.
Ivett and Ludovic are both technically advanced Tableau users so it was great to hear some of their lesser-known tips. They covered things like how to use the SIGN() function, how to create nested dashboards, how to design a landing page for Tableau Server and how to use unicode characters in your vizzes.
If you want to learn more, I encourage you to search the hashtag #biglittletips on Twitter/X where all 42 of their tips are documented!
Tristan Guillevin – Beyond Limits: Unshackling Tableau, Career, and Knowledge
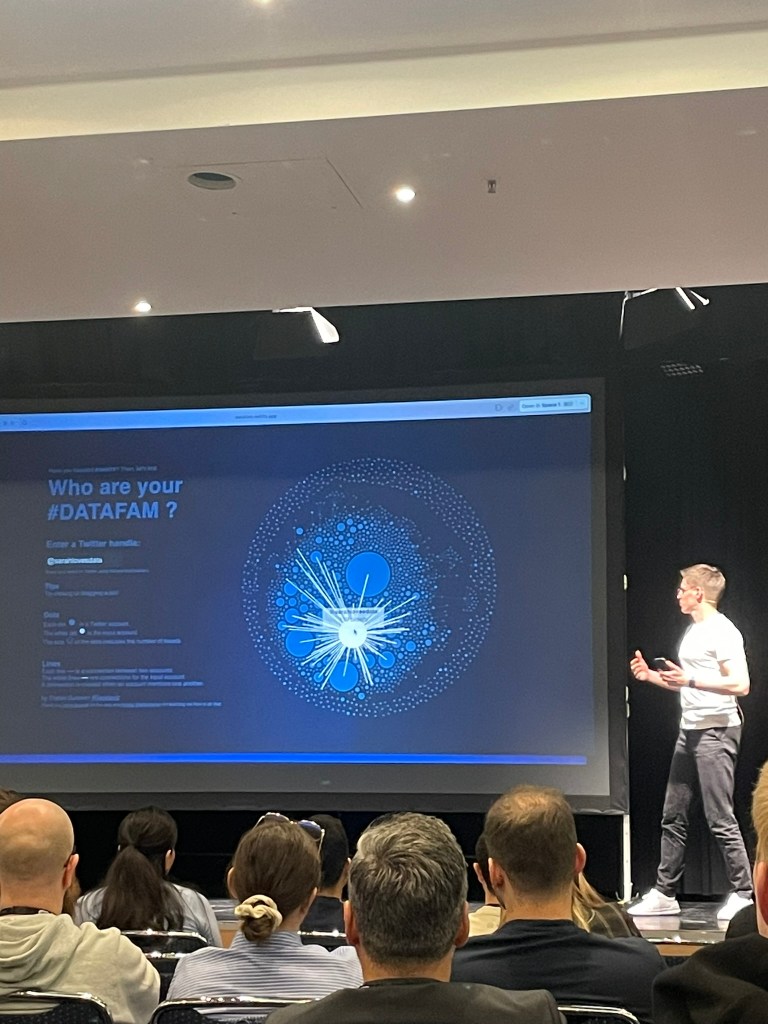
This year, Tristan has quickly become one of my favourite Tableau speakers. If you have the opportunity to watch him present, don’t miss it!
In this talk, Tristan gave an overview of his career to date, including how he discovered Tableau. He discussed how in the past, he may have gotten stuck or lost interest in his work, but also how he has learnt to overcome such issues, sharing advice for those who may be in a similar situation.
Of course, Tristan is recognised for his cutting-edge Tableau tools including AdvViz (Advanced Visualisation Generator), BANg (Big Aggregated Number Generator), and most recently his Figma to Tableau plugin that enables users to turn their Figma designs into fully functional Tableau Dashboards! Since its release, AdvViz has helped users create over 100 Tableau Pubic vizzes using advanced chart types.
I strongly encourage you to try Tristan’s tools for yourself. You’ll find them all here.
Matthew Miller – The Future of Analytics
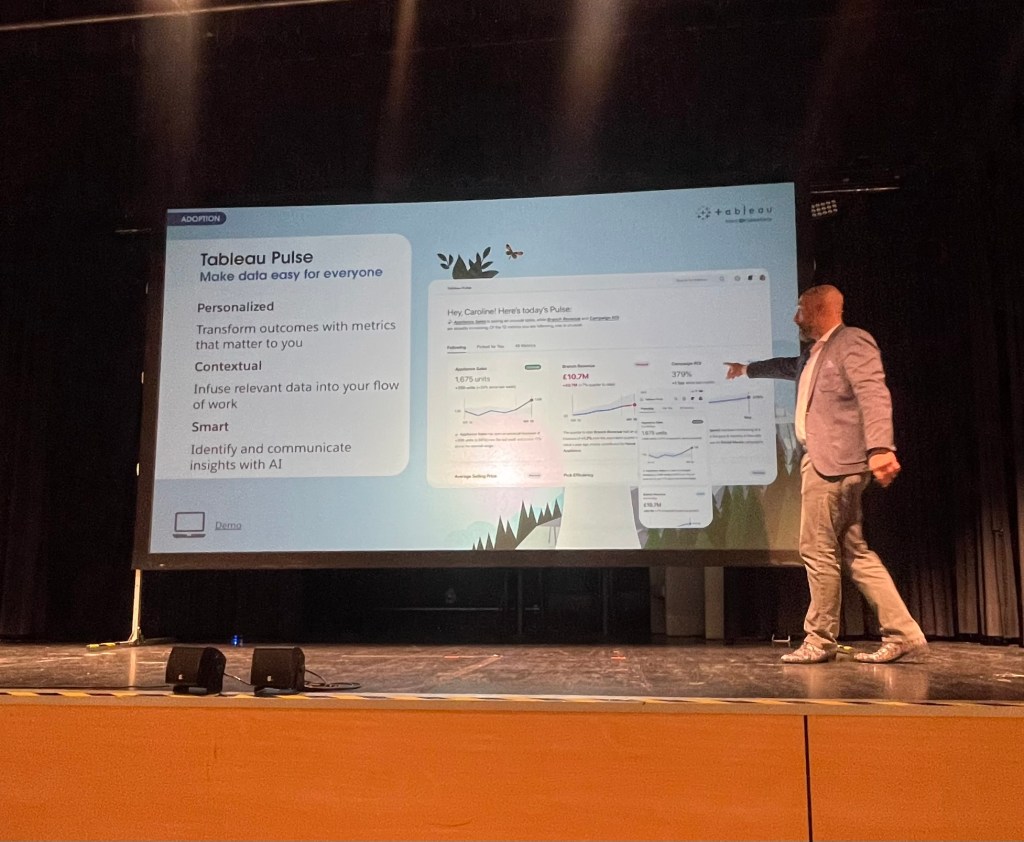
In this talk, Matthew provided an overview of the exciting new features coming to Tableau in the future.
While I have heard about many of these features before, it was good to hear a refresher about what’s coming and what to expect. Matthew covered Tableau Pulse, Einstein Copilot and Data Management features, as well as Tableau Canvas; a new concept designed to visualise the intent of the analysis, show relationships between different entities (i.e. data source and worksheets) and facilitate collaboration between teams and stakeholders.
Thank You
It goes without saying that it takes a village to organise an event like VizIt!
None of this would have been possible without the support of the InterWorks and Tableau teams, as well as my incredible co-organisers Annabelle Rincon, Heide Kalbe and Tore Levinsen. And that’s just the organising team! Let’s not forget the 40+ speakers, Tableau leaders and our sponsors Snowflake, OneData, FiveTran, Wiiisdom and Apps for Tableau, plus Biztory who helped sponsor our evening event. And of course, all of the attendees who took the time to join us in person and support the event.
Thank you to each and every one of you!
Staying Connected
As I mentioned at the start of this post, VizIt Berlin offered the perfect opportunity for the European community to come together, build connections and learn from each other. Opportunities on this scale are rare, but that doesn’t mean there aren’t opportunities to connect with other members of the Datafam in person.
I strongly encourage everyone to sign up to their local Tableau User Group (TUG). You can find your local chapter here. If there isn’t a TUG in your area, there are plenty of virtual TUGs including the Analytics TUG and the Newbies TUG. Both of these popular, virtual-only TUGs meet regularly and feature top name speakers from across the community.
Alternatively, consider setting up your own TUG in your city, if there isn’t one already!
If you spoke at VizIt, please consider sharing your presentation at an upcoming user group meeting. As the VizIt sessions were not recorded, I’m certain there are a lot of people who heard about your talks and would love to experience them too.
What’s Next?
After the success of VizIt Berlin, you may be wondering what our plans are for 2024. We would love to host another VizIt event in Europe but a lot depends on partner and Tableau sponsorship, and whether Tableau decide to host a large-scale community event in Europe themselves.
For the time being, I’m collecting community feedback to better understand what we would like from a large-scale European Tableau event; regardless of if that’s a conference, a VizIt event, or something else entirely.
Please share your feedback here. The survey is open until November 30th, 2023 and the results will be shared with Tableau for review.
Thanks for reading!
Sarah

Looks like you all had a fantastic event Sarah. Congratulations to everyone involved. Where can I get a t-shirt 🙂
LikeLiked by 1 person
Thank you, Steve! The t-shirts were popular and disappeared like hot cakes! 😂
LikeLike