
In 2021, instead of running #IronQuest during the Iron Viz feeder contest, I joined forces with other leaders from across the community to establish an Iron Viz feedback initiative. Together, we worked with over 20 participants to provide feedback on their feeder entries, helping them to refine their vizzes and maximise their chances of scoring highly in the contest.
Thanks to its initial success, we grew the initiative in 2022 and have since run over 80 feedback sessions with Iron Viz participants in 2022 and 2023. In fact, five of the past six Iron Viz finalists, and the past three Iron Viz Champions, participated in the initiative!
I’m excited to announce that the feedback initiative is running again this year and it’s bigger than ever before!
Everything you need to know about the initiative is included in this post.
How does it work?
As an Iron Viz participant, you can sign up for a 15-minute feedback session with one or more of the feedback team. Due to our busy schedules, you’ll be unable to select specific team members you would like to meet with. Instead, upon booking a feedback session, you’ll automatically be allocated to meet with one to four of us, depending on who is covering the slot you have chosen.
When booking your session, you’ll be prompted to share a link to your viz on Tableau Public. Don’t worry if you don’t have it at the time of booking – it can be shared later. It also doesn’t matter what stage your viz is at, nor does it matter if the viz is hidden from public view. We’re happy to provide feedback regardless of where you’re at in the development process. Sharing the link in advance allows us to review your viz before the call and helps us to prepare our feedback. If you don’t share a link to your viz ahead of the call, we won’t be able to provide detailed feedback.
During the call, we’ll ask you to walk us through your viz. It’s helpful if you explain your design and what you are hoping to achieve with it. This will help us to understand your intentions and any relevant background information.
The feedback we share during the session will be centred around the Iron Viz scoring criteria of Design, Storytelling, and Analysis. We’ll aim to share some suggestions to help improve your overall design and approach. We can even offer technical Tableau help, should you need it.
How do I sign up?
Feedback sessions can be booked through Calendly here.
We’ll be running feedback sessions from October 16th to 28th; the final two weeks of the entry window. We’ve found this is the period when participants are most likely to require support with their entries.
Please note, sessions must be booked at least 24 hours in advance of the chosen meeting time.
How long is each feedback session?
Each feedback session is 15 minutes. However, you can book subsequent follow-up sessions if you would like to meet with us again and seek feedback on your updated viz. Many participants have found it useful to do this in previous years.
Who will be providing feedback?
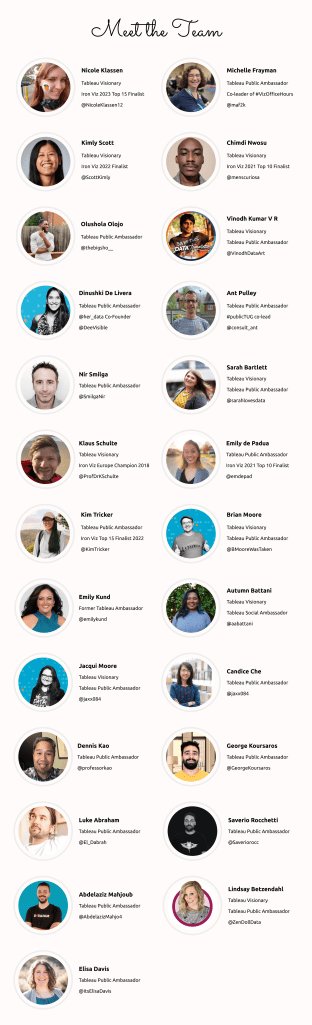
I’ve assembled a team of 24 experts from across the Tableau Community to support this initiative, plus I’ll also be helping out!
I’m incredibly grateful for the support of these amazing team members. The team includes former Iron Viz finalists and participants, Tableau Visionaries, Tableau Ambassadors, community project leaders, and much more!
To ensure maximum timezone availability, we have team members located in the Americas, EMEA, and APAC.
Meet the team:
Ummm….this sounds great but what is Iron Viz?
If you don’t know what Iron Viz is, find out everything you need to know here.
Judging Criteria & Common Feedback Points
Throughout the feedback sessions we’ve supported over the years, there were a couple of common areas we tend to look for improvements on. If you are considering entering Iron Viz this year, these are points you’ll want to consider when building your viz.
Not only that but for the first time, Tableau have also shared some insights into the judging criteria. To receive the maximum number of points for your entry, it’s important that you pay close attention to these points and consider them when building your viz:

Perhaps unsurprisingly, these points closely align with some of the common areas that we see participants overlook when sharing their vizzes in the feedback sessions.
For the most part, the criteria shared by Tableau relate to data visualisation best practices, but there are also some Iron Viz-specific criteria that could easily be overlooked. I advise you to study this list and check your viz meets each point as closely as possible before publishing.
Use of Imagery
Images can be used to enhance your viz design and support the overall story. However, images should be selected with care. As a reminder, Section 4 of the Iron Viz 2024 contest rules states:
“Your Submission must not (in Sponsor’s discretion): (i) violate any third-party intellectual property or other rights, including copyrights, trademark rights, patent rights, confidentiality, or rights of privacy and publicity…”
Before choosing an image, ensure you have the right to use it, being careful not to select images that could infringe copyright. Sites such as Pixabay, Pexels and Unsplash offer images covered by licences that state they can be used for free, for both commercial and personal use. You could also sign up for a MidJourney (or similar generative AI) account and create your own AI-generated images. Always remember to credit your image sources in your viz.
Incorporating Images into the Design
Continuing with the topic of imagery, remember that Iron Viz is an analytics competition that uses Tableau. Images can be used to complement your analytics, but they should always be secondary to the analytics. If your images take up the majority of your viz, you should reconsider your design.
Iron Viz 2022 finalist CJ Mayes touched on this point here:
“The type, size and positioning of still images can make or break a visualisation. Where individuals used images as supplementary aids, it worked really well! But on the flip side, some images can overpower the analytical focus of some visualisations”.
Storytelling, Context and Narrative
The Iron Viz scoring criteria focuses on design, storytelling and analysis but through the feedback sessions, we noticed that some vizzes were weaker in one or more of these areas; namely storytelling. A viz that looks good but lacks storytelling and analysis is unlikely to score highly. Referencing the feedback sessions he supported in 2021, Marc said:
“I often encouraged more analysis and storytelling as well as ensuring the viz gave a good introduction to the (sometimes niche) topic”.
Chimdi also mentioned the importance of creating a narrative to communicate with the audience. Something as simple as explaining the findings of your analysis, in words, and calling out what surprised you, can be an effective approach. Michelle offered a great tip for anyone looking to strengthen the narrative in their viz:
“My favorite piece of advice is to write yourself into the viz. It sometimes felt like people are so close to their topic and had a great passion for it but I often didn’t know anything about it. When someone includes their perspective, it is easier to connect. I also think it improves the storytelling”.
This is something I frequently encourage too. Don’t be afraid to explain why the topic is important to you or to call out data points that resonate with you. For example, if you were doing a viz on the most popular movies, you could highlight your favourites as a way of writing yourself into the viz. This is particularly true this year. The judges will be looking to understand why you love your chosen topic.
Context is also important here. When you have a vested interest in something or are an expert on a subject, you may have a tendency to brush over the starting context as it’s easy to take it for granted. As CJ mentions,
“From a storytelling perspective, this is like starting halfway through a story and hoping your audience will know what you’re talking about. I’d recommend people really plan out what they want to show as a start, middle and end and consider what you want the viewer to take away once they finish looking at the viz”.
Designing for Accessibility
To create a stylish design, it can be tempting to use small font sizes, non-standard fonts and lighter tones in your viz. However, these approaches can often lead to accessibility challenges. Always ensure that your text is readable. Size, contrast and spacing all contribute to this.
The 2024 judging criteria states:
Accessibility is applied – colorblind/low vision (contrast) friendly palette, limited use of images to convey text, font size larger than 12pt
A great resource to learn more about accessibility in data viz is Chartability, created by Frank Elavsky.
As a general rule of thumb, ensure text is no smaller than 12 pt in size. My assumption is this is referring to main body text. For axis titles and labels, accessibility guidance suggests using a font no smaller than 9pt, but the guidance for this isn’t explicitly stated in the judging criteria.
For colours, I recommend using colour contrast checker tools like this one, to ensure there is enough contrast both between the colours in your viz and against the background.
Coolors, which is a fantastic tool to use to generate colour palettes, also has an in-built colourblind/low vision checker which you can use to help generate accessible colour palettes.
Finally, if you’re wondering what is meant by the “limited use of images to convey text” comment, this refers to the popular practice of using other design tools (such as Figma or PowerPoint) to design text elements, which are then added to vizzes as image objects. This practice is popular with Tableau Public authors because it provides greater flexibility and more consistent results than when using non-standard fonts or text layouts in a viz design. The problem with this practice is it doesn’t support accessibility and those ‘text’ images can’t natively be interpreted by a screen reader.
I suggest, wherever possible, to use native text in Tableau. However, if you want to add a fancy title using a custom font, for example, you’ll still need to add this to your viz as an image object.
To ensure any image objects can be interpreted by a screen reader, always ensure you add alt text. You can add alt text in the Edit Image Object dialogue box:

For additional guidance on writing effective image alt text, refer to this guide from Havard University.
Good luck with your Iron Viz entry!
We look forward to seeing you at a feedback session soon!
Thanks for reading!
