
Last week saw the return of the in-person Tableau Conference!
After a two-year hiatus due to the pandemic, this conference was eagerly anticipated and didn’t disappoint. TC22 (Tableau Conference 2022) is the fifth global TC I have attended and attending the conference has been one of my annual highlights since my first TC in Austin in 2016. If you have never attended a Tableau Conference, you may find it strange to hear that I rate a software conference so highly. However, TC is much more than a conference to me. It’s a family reunion. It’s an opportunity to reconnect with old friends and make new friends too. It’s an opportunity to meet colleagues I regularly communicate with virtually and it’s an opportunity to meet people in person that I have only ever connected with over the internet. It’s also a time to get inspired and fuel myself with ideas that will see me through the next 12 months. With the absence of the in-person experience over the past two years, this conference was extra special.
This year, the conference was held at the Mandalay Bay Convention Centre in Las Vegas; the same venue which hosted the conference in 2017 and 2019. However, this year’s conference was on a much smaller scale (~5,000 attendees versus. 18,000 in 2019). While the conference had a smaller footprint this year, the experience was much like any other year, albeit with fewer people. It’s worth noting that the conference was hybrid this year, with free virtual content available for those at home.
Conference Themes
The themes that stood out for me this year were:
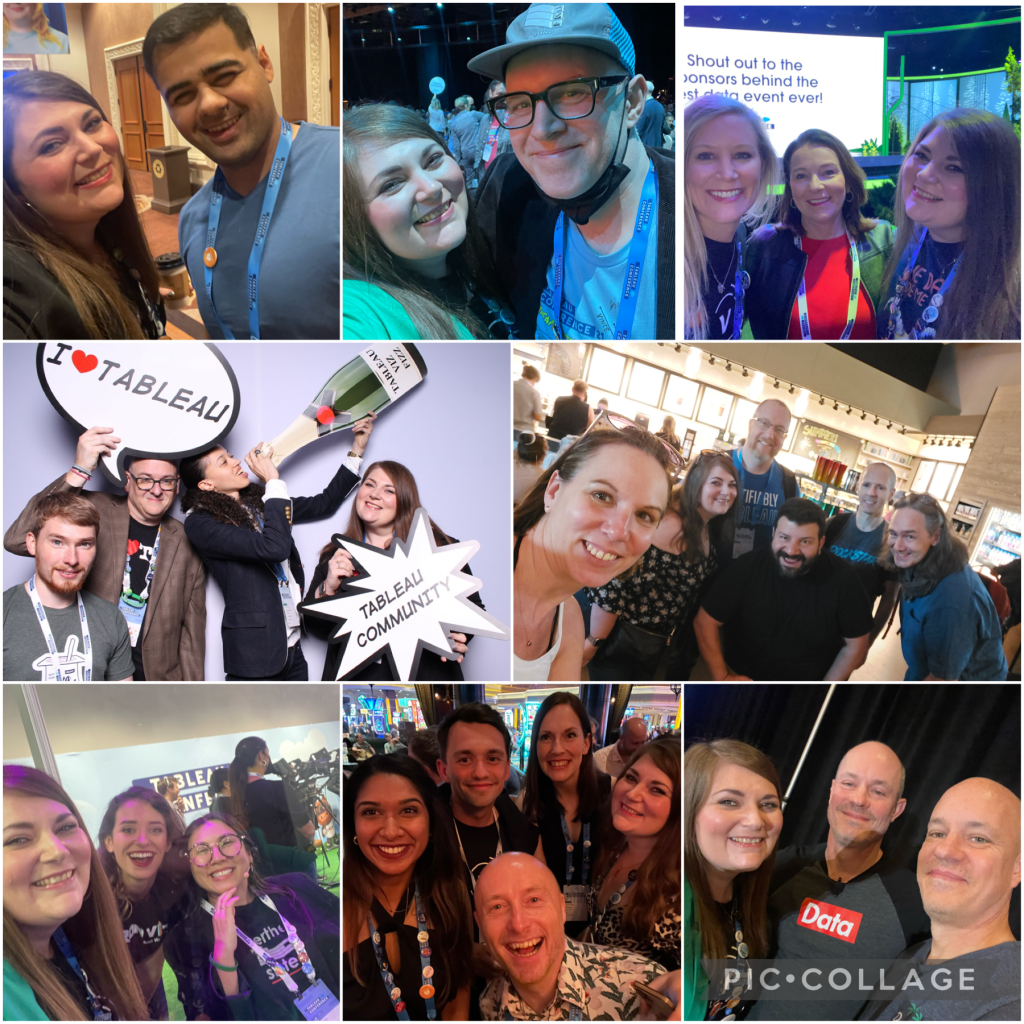
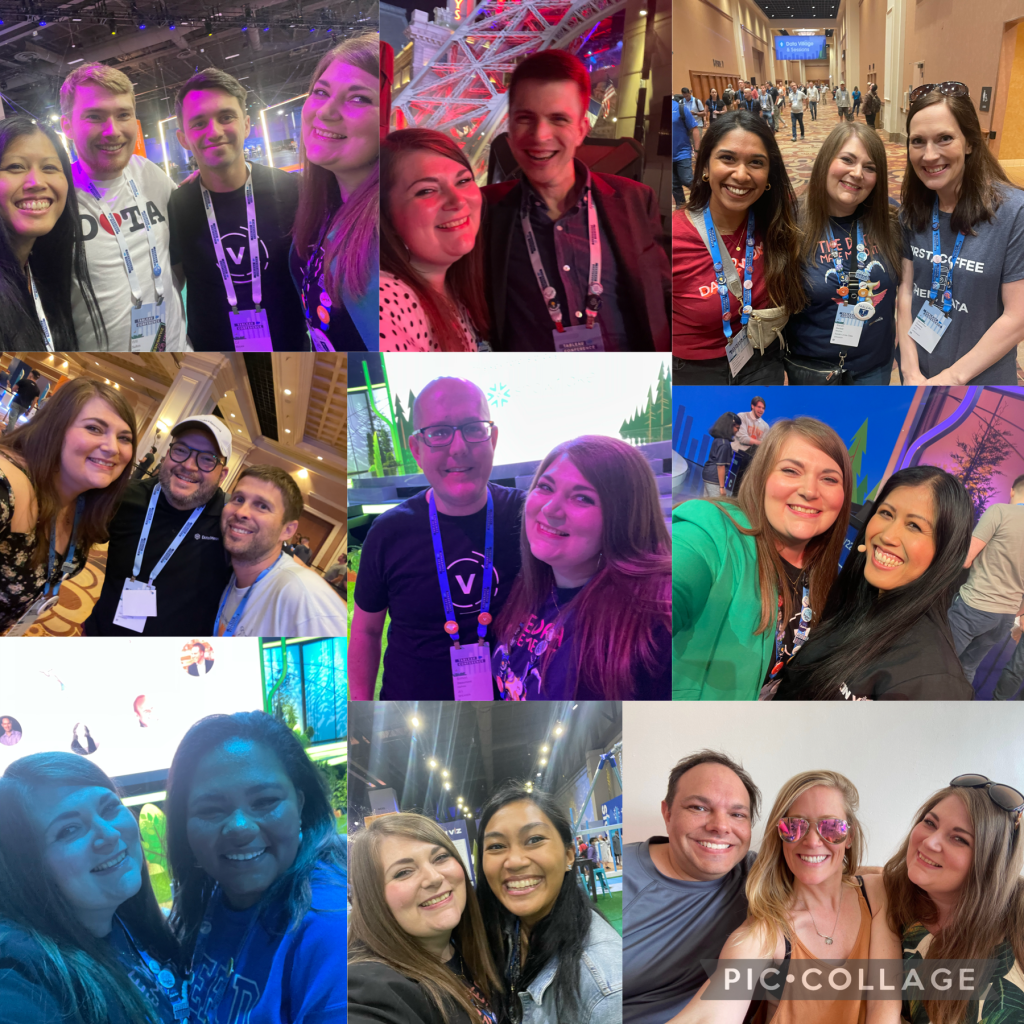
- In-Person Connections; being back in person for the first time since 2019 was exciting! While virtual conferences are good, there is no substitute for meeting people in real life. It was clear that attendees had missed these opportunities and for many, it was their first time meeting community members or the Tableau team in person. There were lots of selfies taken and memories made! I particularly enjoyed meeting the Tableau Community team for the first time. These are a group of individuals we, as Tableau Visionaries and Ambassadors, work with on a daily basis. It was so great to get to know them better at TC!
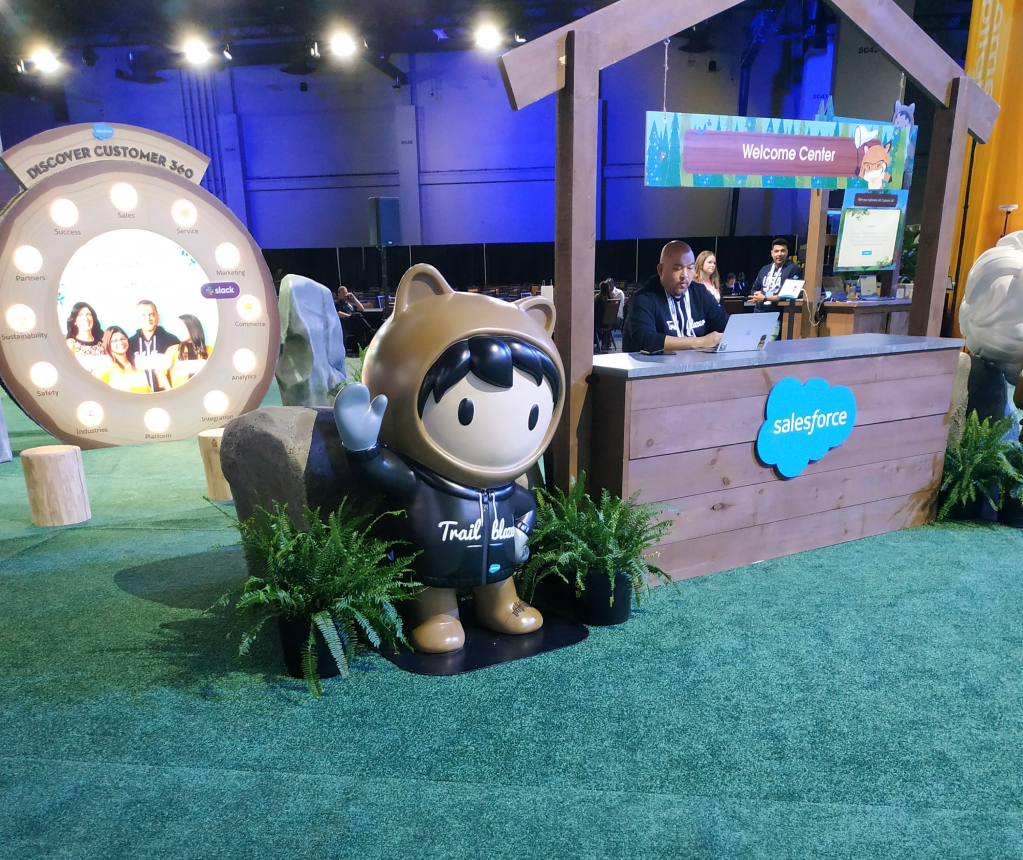
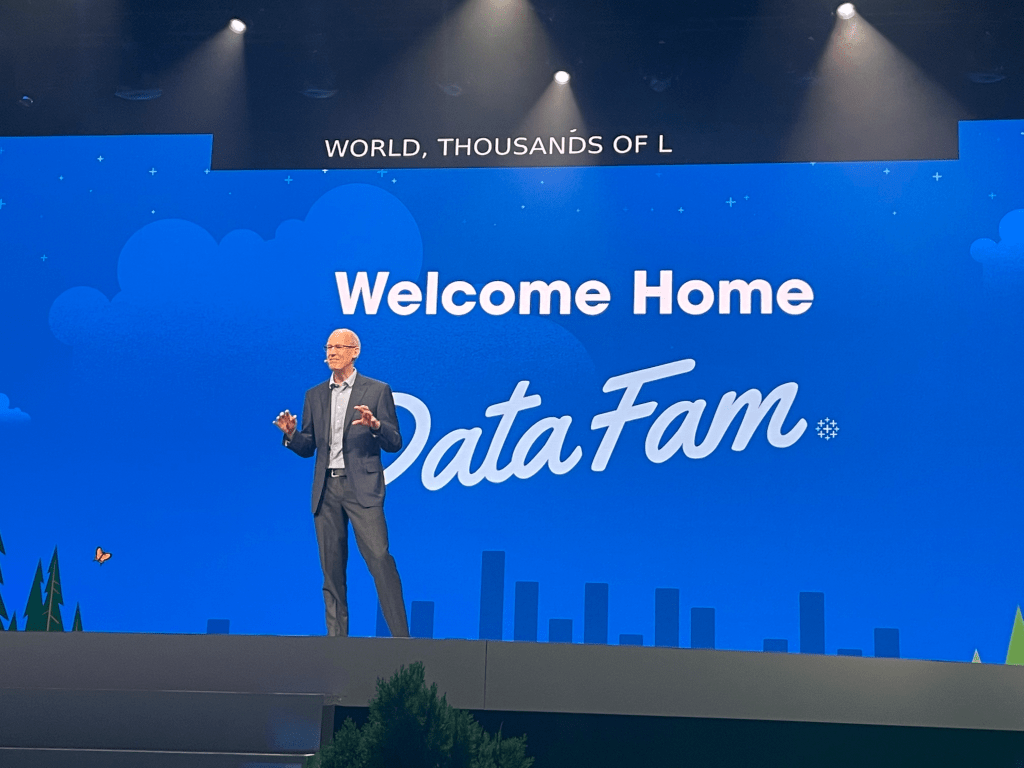
- Salesforce Influence; back in 2019, Salesforce had only just acquired Tableau. While there was a Salesforce presence at TC19, it was only minor. Fast-forward to 2022 and a lot has changed! The two products and brands are much more closely integrated, with Tableau seeing a recent shift to more Salesforce-style branding (think forests, characters and clouds). I think we have all come to accept that Tableau is now a part of the Salesforce family and with that, things look slightly different. Just before TC this year we saw the unveiling of “Data Rockstar Astro”, a Tableau-take on the famous “Astro” Salesforce character. Astro was present across TC and even made an appearance at the Welcome Reception. While I don’t think the community are completely sold on the notion of Astro, I think the conference helped us to become more familiar with “them” (not “he” – Astro is non-binary). To me, Astro represents the essence of Salesforce and the Trailblazer community, not Tableau and the Datafam. After all, Astro is an existing Salesforce character. Until Tableau has either a character of our own or something the community identify with, unfortunately, I think we’ll just have to get used to Astro.
- Listening; with all of the changes that have happened in the last two years, there have been questions raised within the community about the future of Tableau (as we know it) and the Tableau Community. As community members, we hold Tableau near and dear to our hearts. For many of us, discovering Tableau was a life-changing experience and we have built our careers and companies around it. It’s only natural that we have concerns about the future of Tableau since the Salesforce acquisition. At TC, the Salesforce team made themselves available to the community and went to great lengths to listen and put our minds at ease. Bear in mind, that this was the first opportunity the team has had to witness the #Datafam in action and understand a little more about us. I would like to think this was a positive experience for all involved and it was extremely refreshing to see the Salesforce team dedicating so much time to meeting with the community. I hope these conversations and opportunities continue post-conference.
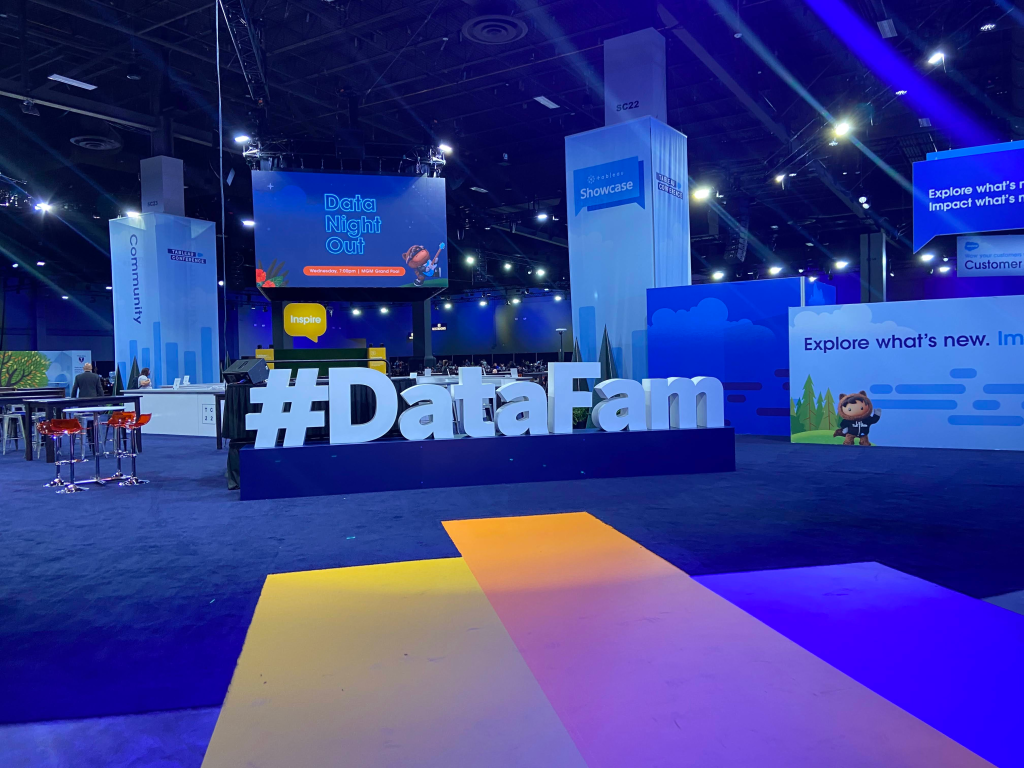
- Community Recognition; the community was at the heart of all things TC this year. The Data Village was dominated by a large community area in the middle of the room, while Tableau Visionaries were featured on the screens in the keynote hall before all keynote talks. This community presence was felt throughout the conference and it was great to see. The community is Tableau’s USP so it’s only right that it’s nurtured and celebrated.
Before it becomes a distant memory, here are my highlights and key takeaways. This post won’t focus on the product announcements specifically but rather on my thoughts from a community perspective on the overall conference experience.
Highlights
Keynotes
The keynote hall looked different this year. Not only was it smaller, with the audience seating all on one level (as opposed to arena-style), the stage was adorned with greenery, similar to what you might expect to see at a Salesforce conference. While some may not be a fan of this styling, I actually really liked it.
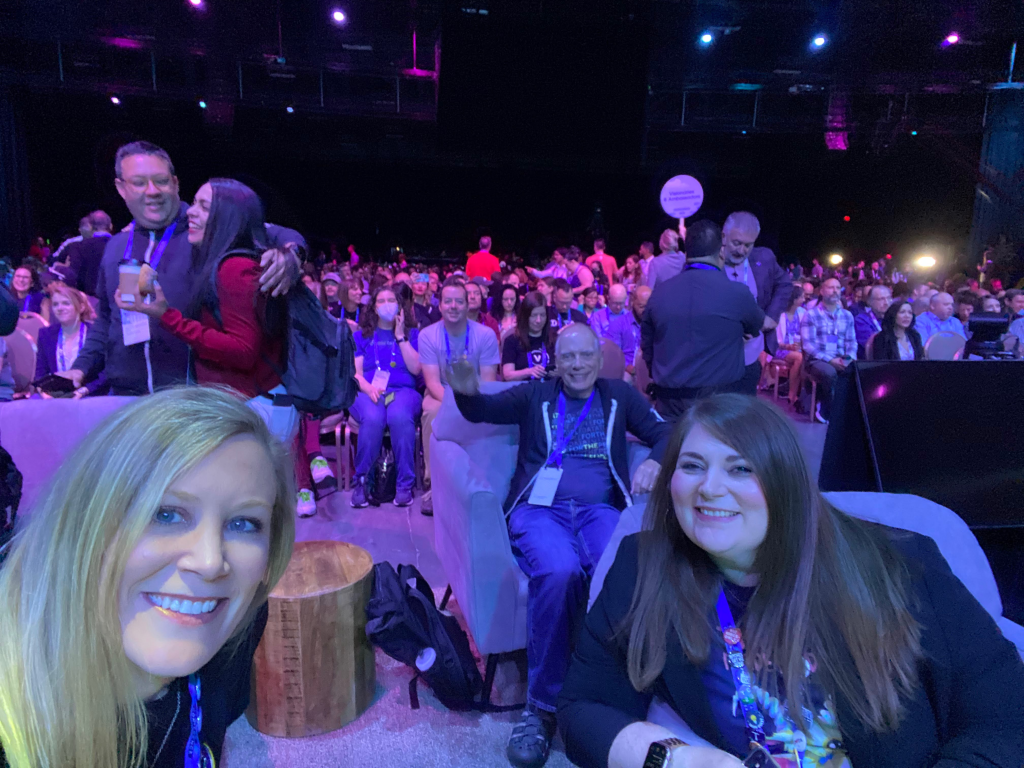
Another difference was the seating plan. At Tableau conferences, you’ll usually find an energetic group of people sitting in the front rows near the stage (no doubt you will have seen photos of the conference front rows at some point)! However, this year, the regular seats were set back further from the stage, with two rows of ‘executive-style’ armchair seats at the front. These seats were offered to community leaders (Tableau Visionaries and Tableau Ambassadors) on a first-come, first-served basis. I was one of the fortunate few that go to sit in these seats. It was definitely a different experience from what we are used to! Here’s a picture of Lindsay Betzendahl and me enjoying the seats for the opening keynote!
This year the conference featured four keynote sessions:
Opening Keynote
The opening keynote included an introduction from Tableau President and CEO Mark Nelson, followed by segments presented by Chief Product Officer Francois Ajenstat and other special guests, including Devs on Stage. The keynote focused on the need for new innovations that bring data everywhere to everyone. The big announcement was Tableau Cloud, the next generation of Tableau Online. You can read more about the keynote and the new feature announcements made during the keynote here.
Thought Leader Keynote featuring special guest, Professor Hannah Fry
In this keynote, Professor Hannah Fry spoke about the importance of looking at the right data when making decisions. It was a thought-provoking talk. I could have easily listened to her speak for another 30 minutes!
Watch the recording here.
The Promise of Data Keynote
In this keynote, Neil Myrick (Global Head of the Tableau Foundation) began the talk by celebrating the work of the Tableau Foundation; a philanthropic initiative led by the employees and partners of Tableau.
My favourite part of this keynote was the fireside chat, led by Channing Nesbitt (Leader of the Racial Justice Data Initiative), with Dr David Turner (Activist Scholar, Post-doc Fellow UCLA in Social & Cultural Studies) and Sheila Herbert (Chief Product Officer, Measures for Justice). The Racial Justice Data Initiative is an $18 million, three-year commitment from the Tableau Foundation to support the data infrastructure and capacity of organizations across the U.S. fighting anti-Black racism. Hearing Dr David Turner speak passionately about the work he is doing to negotiate and win demands for racial justice, secure funding and divest resources from punitive and harmful institutions, all of which are underpinned by data, was incredibly powerful.
Watch the recording here: https://www.tableau.com/events/tc/2022/live-promise-data-keynote#form-gate-content
Iron Viz
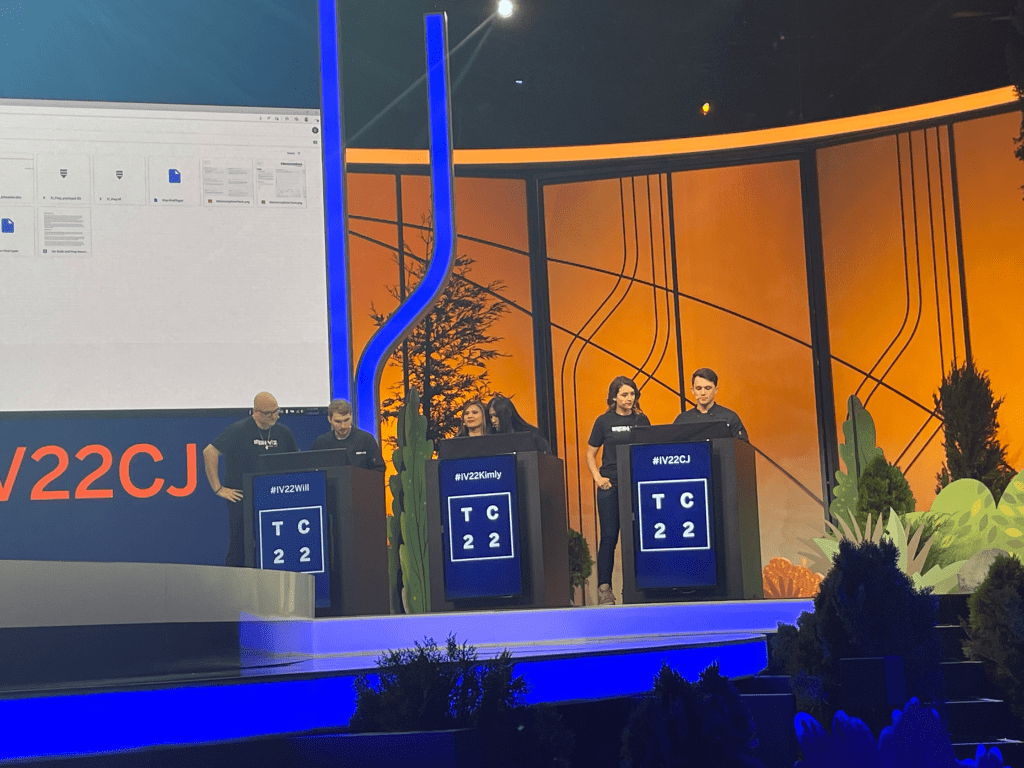
Always a conference highlight, this year’s competition did not disappoint! In Iron Viz 2022, we saw CJ Mayes, Kimly Scott and Will Sutton go head-to-head to fight for Iron Viz glory! Bear in mind, that this is the first time we’ve seen Iron Viz on the live stage since 2019 so it was particularly exciting!
After competing in Iron Viz Europe in 2018, I have a particular appreciation and respect for the contestants and everything they go through, both on stage and in the lead up to the competition. Iron Viz is not easy and an incredible amount of work goes into the competition behind the scenes, even before the live show. For the contestants, their work started way back in January when they prepared their feeder contest vizzes. After being announced winners, they were provided with the dataset visualised on stage which they had to clean and shape using Tableau Prep, before coming up with a compelling story and viz design for the live show. Whilst in Las Vegas, the entire Iron Viz team (including the sous vizzers, hosts and judges) spent days in rehearsals to ensure the live show was production-ready.
I was on the edge of my seat for the entire 20 minutes and anxiously watched as they raced against the clock to build their best vizzes. All three contestants did a fantastic job in visualising the education data set they had been provided and they all delivered an impressive presentation of their work afterwards. Each contestant took a completely different approach.
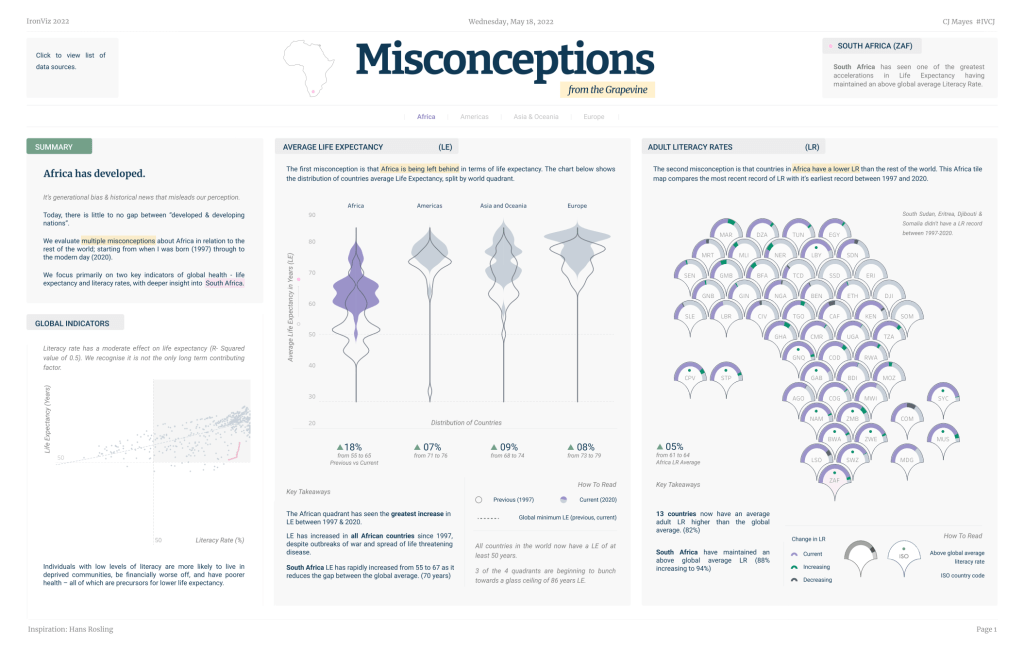
CJ’s viz was beautifully designed, newspaper-style viz focusing on literacy rates in South Africa, versus the rest of the world. It featured the most technically-challenging visualisations, including a violin plot and ‘grape’ map of Africa, as well as careful attention to detail throughout. His viz was a single page view and probably the most reminiscent of a typical Iron Viz-style viz. With the newspaper-style design, it reminded me of Shine’s winning Iron Viz entry from 2015.
Kimly’s viz was a long-form design which focused on comparing literacy rates in Australia and Cambodia. It’s rare to see a long-form design presented in Iron Viz so this was interesting to see. Kimly was born in Cambodia but raised in Australia so wanted to compare the two countries and consider how different her life would have been had she stayed in Cambodia. Kimly applied a clever flashlight design to emphasise the data points of interest in her viz. Kimly certainly had the most personal and emotional story to tell, with many people in the audience commenting how the story brought a tear to their eye.

Will’s viz featured a pagination-style design with the viz split across multiple pages. This is unusual for Iron Viz, where the vizzes tend to be single-screen views. Using a sample of 100 people, Will used a unit chart to visualise how global literacy rates have changed in the last 20 years. Clicking through the pages, Will was able to use animation to visualise change over time and tell a compelling story. Will even humanised the dataset by including examples of stories from people around the world whose lives had been impacted by either growing or falling literacy rates.
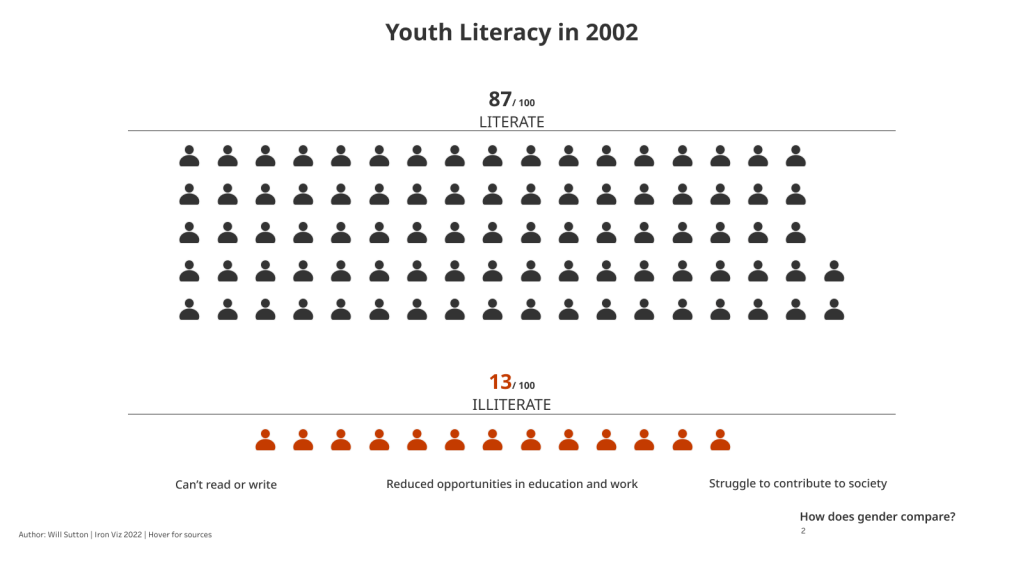
As we know, there can only be one winner and Will was crowned champion in this year’s competition!

If you haven’t already, I would encourage you to check out all three vizzes on Tableau Public!
Sessions and Talks
I had the opportunity to deliver two talks at Tableau Conference this year.
Firstly, after Iron Viz, I joined forces with Simon Beaumont and Christian Felix (both of whom were contestants in the 2020 Iron Viz competition), to celebrate the top 10 winning vizzes from this year’s Iron Viz feeder contest. This session was a great way to explore and celebrate what it took to make the main stage this year, whilst digging deeper into the works of CJ, Kimly and Will. For this session, we went through each of the top 10 individually, describing what we thought made them stand out. We were privileged to be joined in person by Emily de Padua, author of “Color Studies”, which came in 7th place. Emily joined us on stage to talk through her viz and her design process. Her ternary plot design even caught the attention of Iron Viz judge and Vice President of Research and Design at Tableau, Jock Mackinlay, who was in the audience!
I really enjoyed presenting this session! It was a nice way to wrap up Iron Viz and I hope we see it back on the conference schedule in 2023.
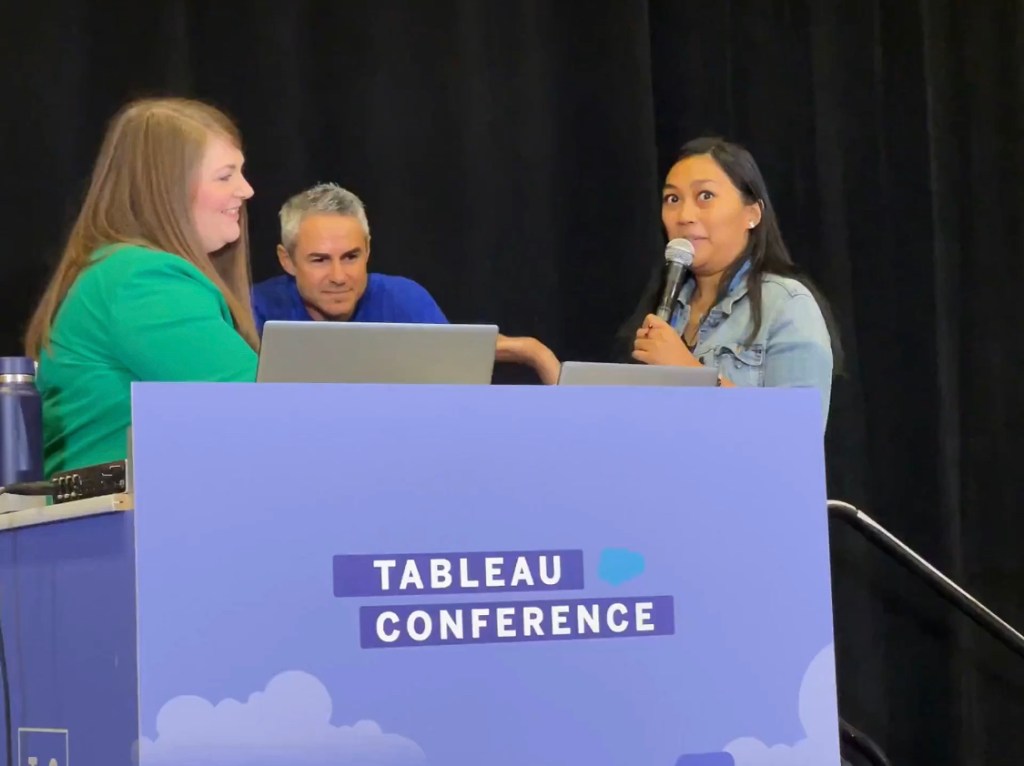
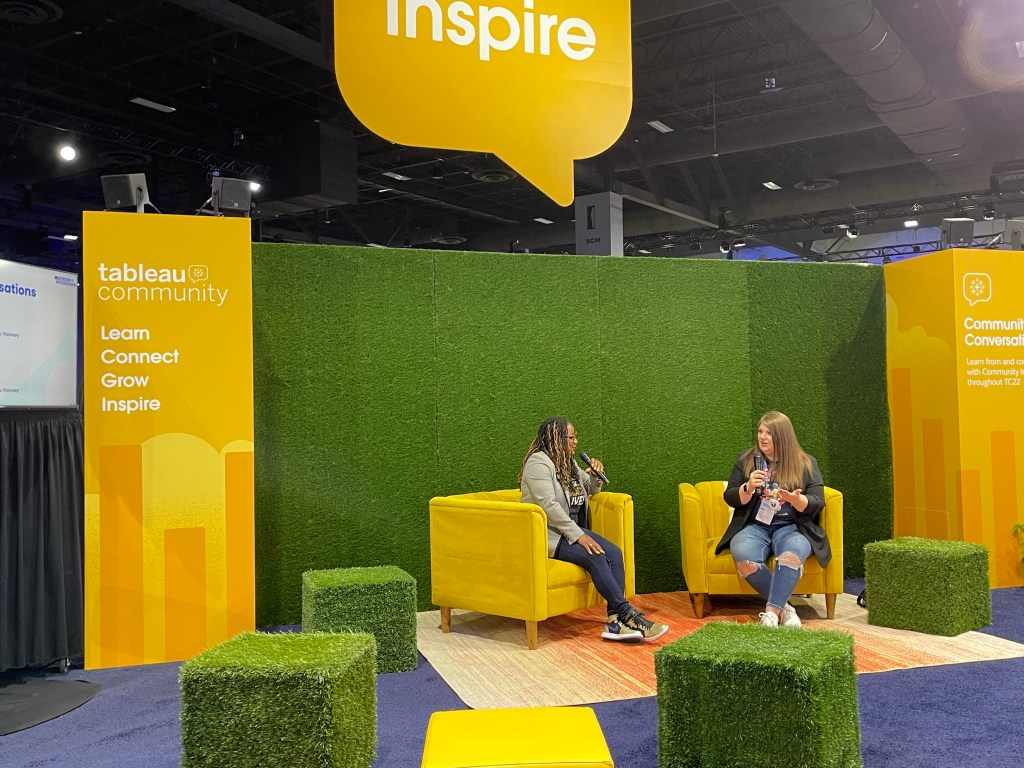
Secondly, I had the opportunity to speak in the community area in the Data Village. For this session, I had the privilege of being interviewed by Dana McKelvey, Corporate Marketing Manager at Salesforce. We spoke about my Tableau journey and I shared advice for anyone looking to get started with Tableau today. Thank you, Dana, for this amazing opportunity!
Unfortunately, due to my busy schedule, I didn’t get to attend many talks this year. I would have loved for the conference to be slightly longer. It felt like this schedule was extremely condensed this year, making it difficult to fit in everything you wanted to see. Furthermore, the majority of sessions were not recorded so if you were unable to attend a session in person, you truly missed out! That being said, I’m hopeful that many of the community speakers will repeat their sessions at TUG meetings in the next few months.
Watch this space!
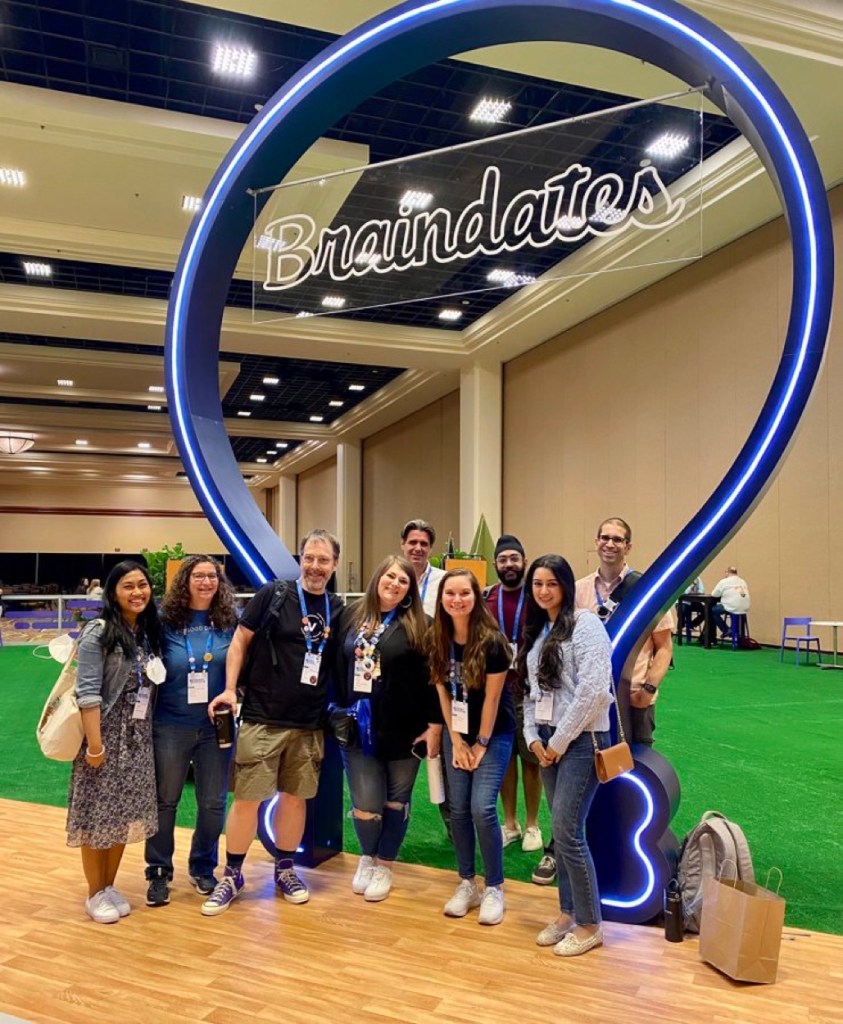
Braindates
Braindates provide an opportunity for conference attendees to come together to share their knowledge or advice on a subject of their choice. At TC, it can be difficult to find other attendees with similar interests or passions so Braindates offer the perfect solution to bring people together for a focused discussion.
I had the opportunity to participate in three Braindate sessions this year where we spoke about COE’s, Tableau Champions programs and also a meeting of #MomsWhoViz; a group of Mum’s from across the community who share advice and support for fellow Mum’s! In all three of my Braindates, we had great discussions and I left with plenty of inspiration to take forward in my day-to-day work.
The Vizzies
The Vizzies Awards, hosted by Matt Francis and Emily Kund, are always a conference highlight! These awards are nominated by community members, for community members, to recognise excellence, talent, and those going above and beyond to inspire others. The Vizzies are open to non-Visionaries only and Matt and Emily are also exempt from winning.
After two years of being run virtually, it was great to have the Vizzies back in person this year! Nothing beats seeing the winners walk up to the stage to collect their awards!
I’m particularly proud of Autumn Battani who received the Michael W. Cristiani Community Leader Award this year. I was the first recipient of this award back in 2018 and, as such, it holds a special place in my heart. The award is named after Michael W. Cristiani, who sadly passed away a few years ago. Michael was a loyal member of the Tableau community and had attended the Tableau Conference every year since the very beginning. Not only was Michael an advocate of the tool itself but he was also passionate about building connections with others across the Tableau Community. While he wasn’t the most outspoken community member, behind the scenes he was always helping to mentor, connect and introduce people. Over the past 18 months, Autumn has worked tirelessly to inspire and teach the community through her blog posts, Tableau Public vizzes, YouTube videos, TUG talks and community initiatives. Her impact stretches far and wide and she is a true inspiration. If anyone is deserving of this award, it’s Autumn!
Congratulations to all of this year’s winners! Refer to this blog post for the full list!
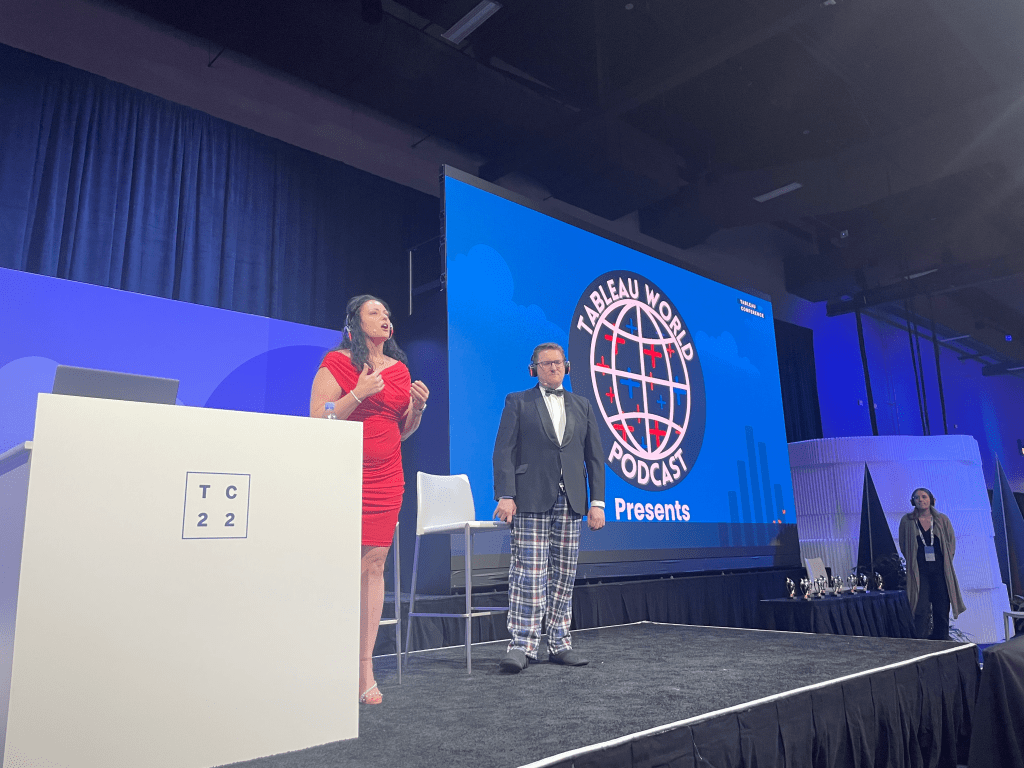
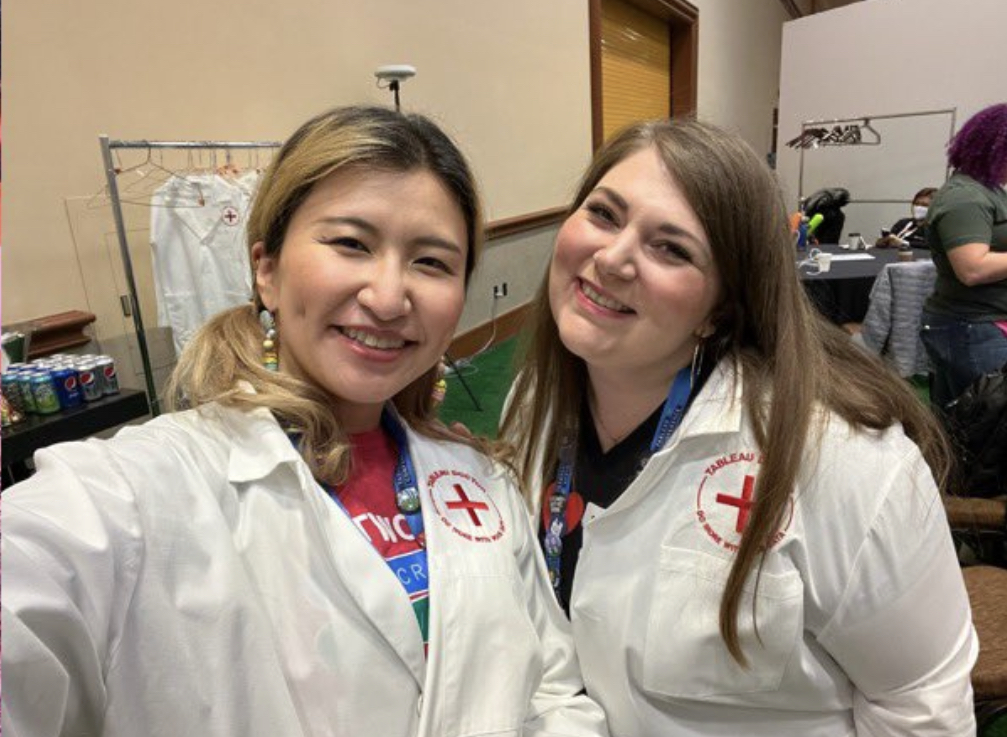
Tableau Doctor
As a Tableau Visionary, I had the opportunity to help out with Tableau Doctor at TC this year. If you don’t already know, Tableau Doctor is like a real doctor, but for Tableau problems. Attendees can book appointments to see the Tableau Doctors, who are made up of both Tableau staff and Tableau Visionaries.
While I have supported Tableau Doctor multiple times since becoming a Zen Master/Visionary in 2020, this was my first time having the opportunity to volunteer as a Tableau Doctor in person! All-in-all it was a great experience! It was so rewarding to share solutions that I knew were going to massively help people with their day-to-day work.
The best part – we got to wear lab coats like real Doctors!
Community
What made the conference really special this year were all the great people I got to meet. I lost count of the number of people I bumped into between sessions and at various events. Some of these people I have been chatting to for years on Twitter, while others were familiar with my work and just wanted to say hello. I had some great conversations in the corridors and hope these conversations continue post-conference. Likewise, it was so great to reconnect with old conference friends.
Being a global community, we rarely have opportunities to connect in person like this. That’s why we should treasure these moments as we never know when we’ll have the opportunity to see each other again.
Attending #data22 was a memorable experience and I have returned home feeling refreshed and full of inspiration to take forward in my day-to-day Tableau work.
“Don’t cry because it’s over, smile because it happened” – Matt Francis
Thanks for reading!
