
For the second #IronQuest project of 2022, I had the pleasure of teaming up with Sean Miller and the #DataPlusMusic project to co-host the ‘Music Firsts’ round. For this round, we challenged participants to take a trip down memory lane and visualise data relating to a music memory or experience; whether that be an early music purchase, their first concert, or their favourite artist growing up.
We received a total of 5 submissions for this round and welcomed one first-time participant to the project. As always, it was fantastic to see the diverse range of topics covered and the creativity shown throughout the entries. While a few participants focused on their experiences with live music, others looked more broadly, either at the history of music over the last half-century, particular eras of music in modern history, or the evolution of music formats over time.
For this round, all feedback will be shared with participants directly rather than via the usual YouTube video.
Let’s explore the entries!
Jason Knudson | The Top 500 Albums of All Time
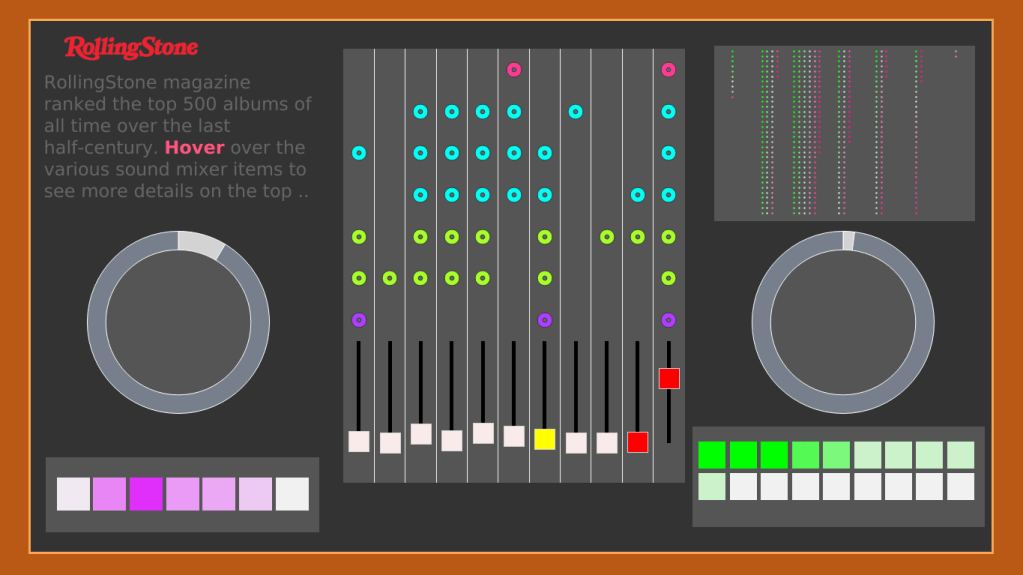
For this viz, Jason used a DJ mixing table to visualise the Rolling Stone top 500 albums of all time (over the last half-century). Jason invites the audience to hover over the various elements on the mixing table to view more details and analysis of the top albums, bands and genres featured in this collection of albums. There are tons of insights packed into the innovative viz! I encourage you to explore it for yourself on Tableau Public.
Jessica Moon | Living in the 90s
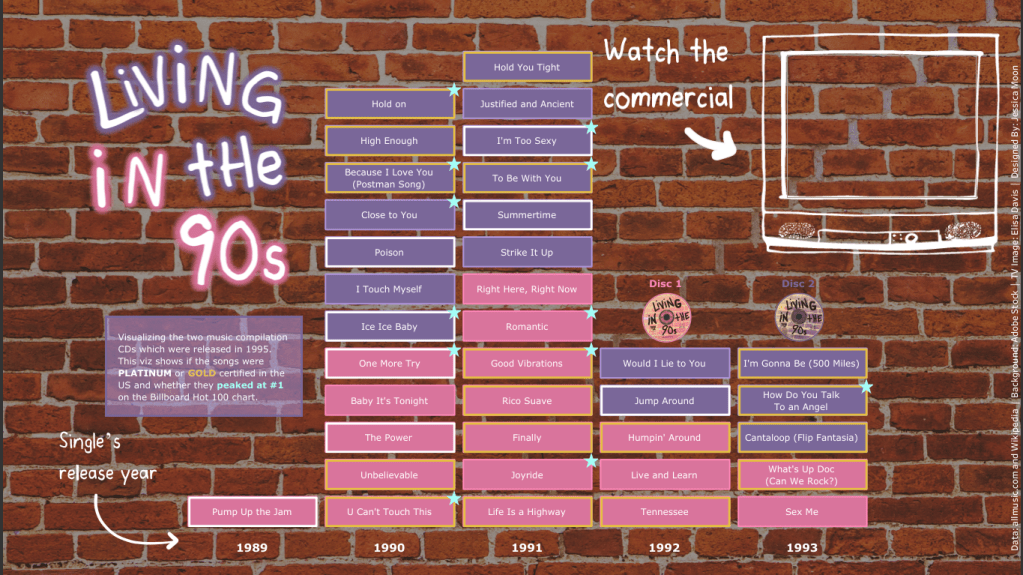
For this viz, Jessica took us right back to the 90s with her on-theme, fun design! This viz explores the tracks included on the ‘Living in the 90’s’ two-CD compilation, released in 1995. Jessica even included a TV on her viz for the audience to watch both the commercial for the CD, as well as the music videos for each of the tracks so you can immerse yourself in the very best of the 90s without even leaving Tableau!
Michelle Frayman | Imagine Dragons Evolve
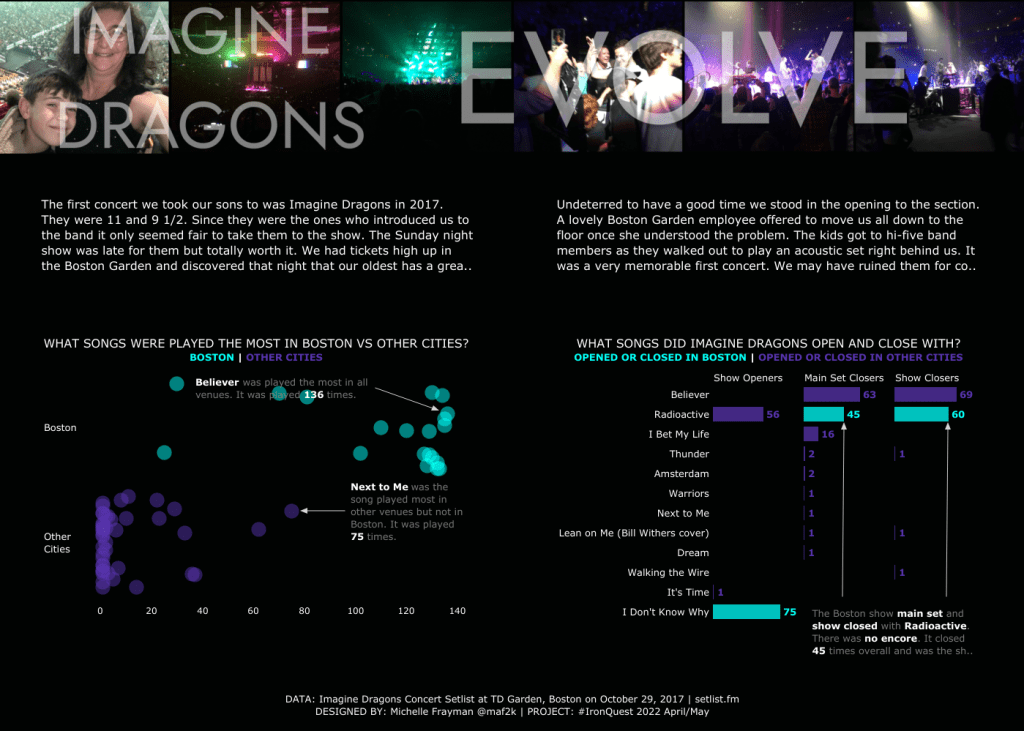
For this viz, Michelle visualized the Imagine Dragons 2017 ‘Evolve’ tour. Michelle attended the Boston night of the tour with her family and for this viz, compared the set list from the Boston show with other nights on the tour. She also explored the most-frequent show openers, main set closers and show closers. I love how Michelle included a quantified-self element to this viz and approached the data from a personal perspective to help tell a compelling story.
Patrick Sarsfield | Bad to the Bone: George Thorogood and The Destroyers 50/50 Tour
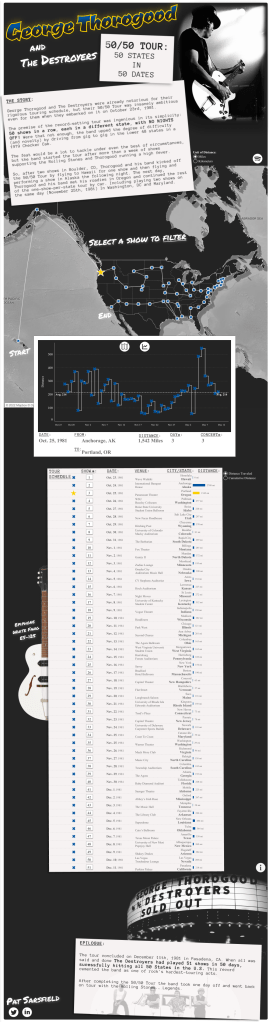
For this viz, Patrick visualised the epic 50/50 tour by George Thorogood and The Destroyers in 1981. The tour featured 50 shows in a row, each in a different US-states, with no nights off in between! The band even drove from gig to gig in the Lower 48 states in a 1979 Checker Cab!
In the viz, Patrick mapped out the journey taken by the band across America, starting in Hawaii and ending in California, whilst calculating the distance between the venues on the route. This viz features a great design and includes some nice interactive elements such as the pop-out line chart and different ways for the audience to display the data.
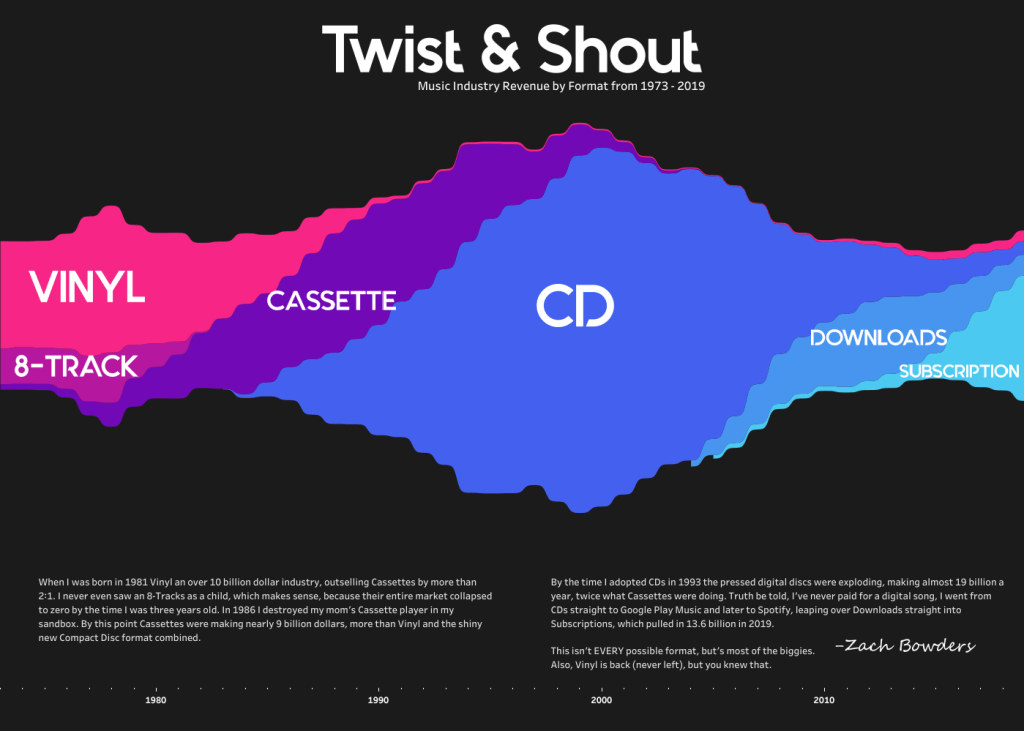
Zach Bowders | Twist & Shout
In this viz, Zach explores the evolution of the different music industry revenue formats, starting in 1973 when vinyl was the dominant music format and ending in 2019 when downloads and subscriptions were the most popular ways to consume music.
This viz features a compelling stream graph design that emphasises the CD-dominant era from the mid-1990s to the early 2000s. I like how Zach has included a personal commentary describing how his music consumption formats have changed over the years, too.
If you would like to join the next project, we’ll be launching a brand-new #IronQuest project on July 1st! Stay tuned for more information to be shared soon!
In the meantime, stay up to date with all things #IronQuest by following the hashtag #IronQuest on Twitter and LinkedIn. Check out the Iron Quest section of my blog for details of the latest projects and how to participate.
Thanks for reading.
