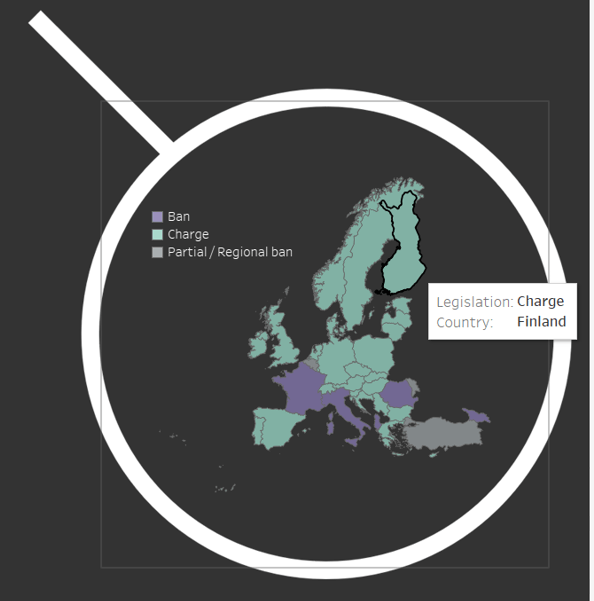
For my #IronViz Europe 2019 entry I created a map which appears contained within a magnifying glass:

Prior to the introduction of transparent sheets in Tableau Desktop version 2018.3 this effect was possible using a shape with a transparent centre. However, in earlier versions of Tableau any map interactivity would be lost when applying this technique since the shape overlays the map. While the shape appears transparent and we can view what lies beneath (the map), the image itself in Tableau is not so any interactivity from the sheet at the back would be masked by the image. Thankfully, the transparent sheets feature enables us to apply this technique whilst maintaining the interactivity from the sheet at the back. Please note, you don’t necessarily need to use circular images for this technique. Pick any shape you wish!
Let me explain how to apply this technique in your own work.
Building Transparent Shapes in PowerPoint
In this example I am using a magnifying glass shape which I created in PowerPoint. It’s nothing fancy; simply a transparent circle with a white border and a handle (essentially a straight line). What’s important here is that the shape you use has a transparent centre.
To achieve this in PowerPoint, simply select your shape and navigate to the Format menu.
Ensure your shape has a solid fill and transparency is set to 100%:

Save the image to your computer so you can bring it into Tableau later.
Tableau – Step 1 – Build a Map
Build a map in Tableau. In this example I am using a filled map but this technique should work with any type of map.
Note in this example I am designing a map for a dashboard with a dark background. However, you can set the dashboard background to a colour of your choice.

Tableau – Step 2 – Remove the Map Layers
Remove ALL map layers. You can do this by navigating to the Map > Map Layers menu. You can remove the layers one-by-one by simply selecting the ticked boxes in the layers list.
In the images below the default Map Layers menu is shown on the left and the menu with the layers removed is shown on the right.
Notice how the “State/Province Borders” menu is greyed out in the right-hand menu? If you experience a similar issue, proceed to Tableau Step 3. Otherwise skip to Tableau Step 4.


Tableau – Step 3 – Remove the State/Province Names
To remove the tick in the “State / Province Names” box you’ll need to zoom in on your map. Zoom in and check the May Layers options again. Repeat this step until you are able to remove the tick.
Tableau – Step 4 – Build a Dashboard
Place your map on a dashboard. If you are setting the background of your dashboard to a colour other than white I would recommend you do this before bringing in the map.
Hide the title of the map. You can do this by hovering over the title area at the top of the map and right-clicking, then select “Hide Title”.
At this stage my map looks like this:

Tableau – Step 5 – Remove Shading
If, like me you are using a non-white background, go back to the map sheet and select Format (from the main toolbar) > Shading. This will display the Format pane on the left-hand side. On the sheet tab, set both the Worksheet and Pane options (at the top) to “None”. When you navigate back to your dashboard, your map should now blend in.
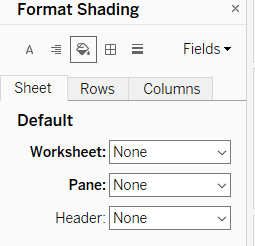

Tableau – Step 6 – Remove Map Borders
You’ll notice there is a white box around the map. To remove this, navigate back to the Format menu (you can do this in the sheet or from the dashboard, assuming the sheet is selected) and select “Borders” from the icon options at the top. You need to remove the borders from the Row Divider and Column Divider. Change both of these to “None”:

When you de-select the map on the dashboard (click anywhere else on the dashboard), the borders should disappear. A white box will still appear around the map when it is selected but this won’t be visible once the dashboard is published.
Tableau – Step 7 – Import Your Transparent Shape
Now we’re ready to bring in the shape we created in PowerPoint (or similar).
Add your shape to the dashboard by selecting “Image” from the Objects Pane on the left-hand side. I suggest you add it to the dashboard as a floating image for ease. You can do this by selecting “Floating” at the bottom of the Object pane. Locate your image file and bring it onto the dashboard.
You’ll need to re-size your shape so it completely covers and contains your map. You can do this by dragging your shape on top of the map element and resizing accordingly. Once you are happy with the size and placement, open the dashboard item menu by selecting the downward arrow in the top right-hand corner of the image.
Select Floating Order > Send to Back:

This will send your image behind the map so your map will still be fully interactive!
Tableau – Step 8 – Switch Off Map Options
Now you have created a beautiful, perfectly placed map you’ll want to ensure it stays in the right position. To ensure your dashboard users cannot pan/zoom you need to switch off his option from the map options menu. With maps like these I prefer to turn off all of the available options so the map menu does not appear when using the dashboard.
You can do this by selecting your map on the dashboard and navigating to the Map menu from the toolbar. Select Map Options to display the menu. Deselect the options from the menu as necessary:

So there you have it! You should now have a fully interactive map contained within a shape!

You can download a sample workbook I put together for this blog post here.
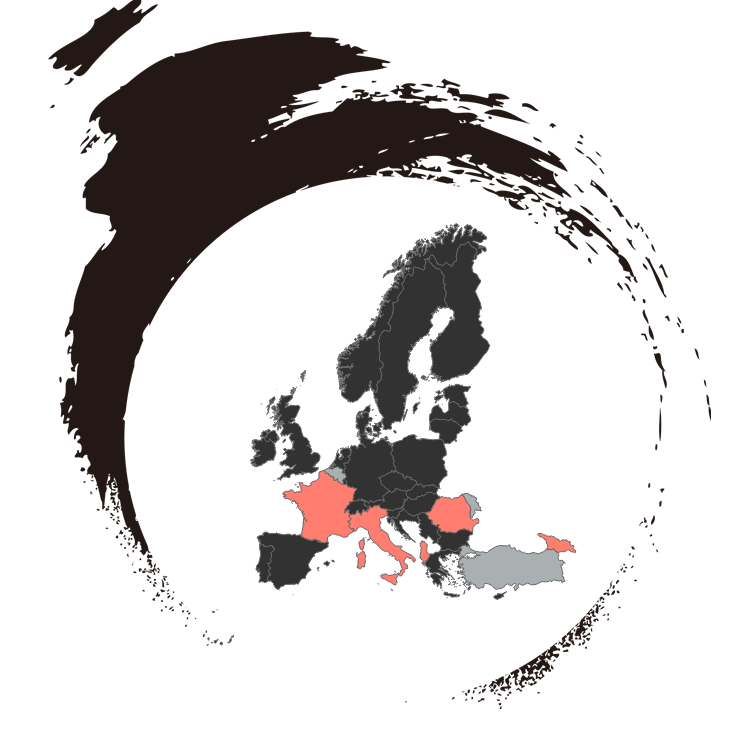
I hope you find this technique useful. I would love to see what you achieve when applying it in your own work. This is only a basic example. There are many more fun applications you could try. Take the one below for example which uses a PNG shape with a transparent centre:
Many thanks to Simon Beaumont who helped me to understand this technique better!
Thanks for reading!

Thank you for sharing a detailed post, Sarah.
LikeLiked by 1 person