Last month I launched #IronQuest, a new community-led data visualization project which follows a similar format to the Tableau Iron Viz feeder competitions. Participants have a calendar month to source a suitable data set and then design, build and submit a data visualization. Every submission should use a data set that somehow touches upon the chosen theme for that month and every viz should aim to showcase best practices & skill in design, storytelling & analysis. The objective of #IronQuest is to provide individuals with an opportunity to practice both their data sourcing, data preparation and data visualization skills without the pressure that comes with participating in a competition like Iron Viz.
Crime Data
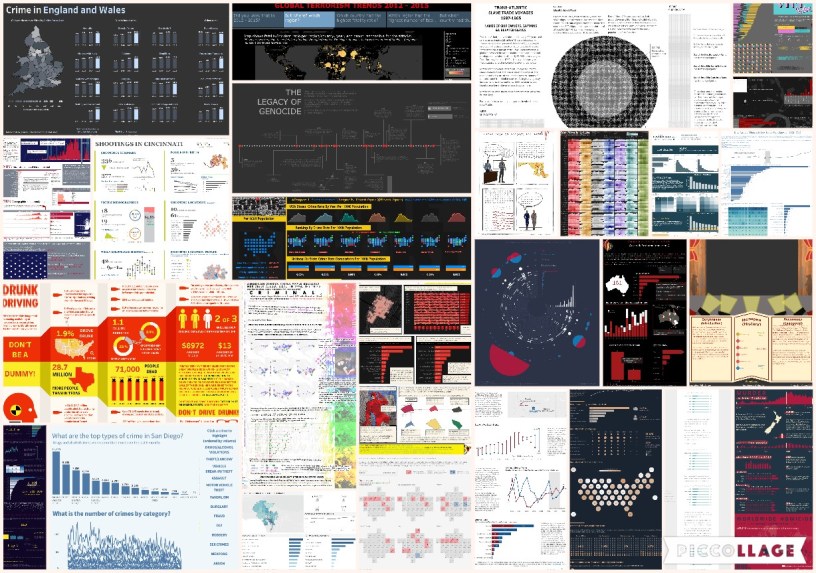
For month one (January 2019) the chosen theme was crime data. I was a little apprehensive to see how the challenge would be received by the community but I needn’t have worried. With a total of 27 submissions, I was blown away by the response to the challenge! It has been great to see so many visualizations published as a direct result of this project and also to see them be so well received by the community.
The participants truly applied the crime theme in ways I could never have predicted. We saw everything from vizzes on crime-fighting comic book heroes to cyber crime, drunk driving, mass shootings, song lyrics, genocide and even slavery. Topics aside we also saw a wide variety of chart types and techniques applied in the submissions; including but not limited to horizon charts, games, drunken goggles, custom animation, story points, infographics and gauge lines.
Reigning Iron Viz Champion Timothy Vermerian joined me as my guest co-host this month and together we had the pleasure of reviewing 17 entries, providing detailed feedback to those had requested it. It has been great to see some iterations as a direct result of this feedback too.
THANK YOU to everyone who submitted entries for taking the time to create and share your work! Also, a big thank you to Timothy for being a fantastic co-host.
The entries are posted below in alphabetical order by first name. If you tweeted you viz or thought you submitted one via the Google form but but don’t see it here, let me know and I’ll work to include any additional entries ASAP.
Please click on the images to view the visualizations on Tableau Public (or similar). Show your support for the participants by favouriting the vizzes you like the most.
Alex J.
A Sad Truth – The Rise of Mass Shootings in the US
Twitter: @jusdespommes

Anna D.
Cybercrime in Healthcare – Healthcare attracts attention from cyber criminals
Twitter: @AnnDzikowskaViz

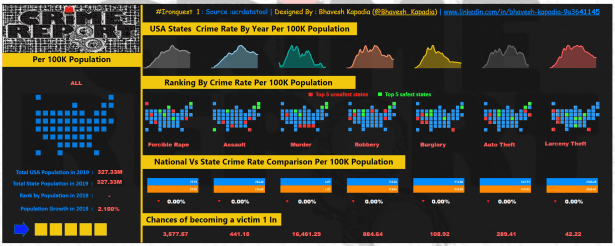
Bhavesh K.
Crime Report
Twitter: @Bhavesh_Kapadia
Charles S.
180 Days of San Diego Crime

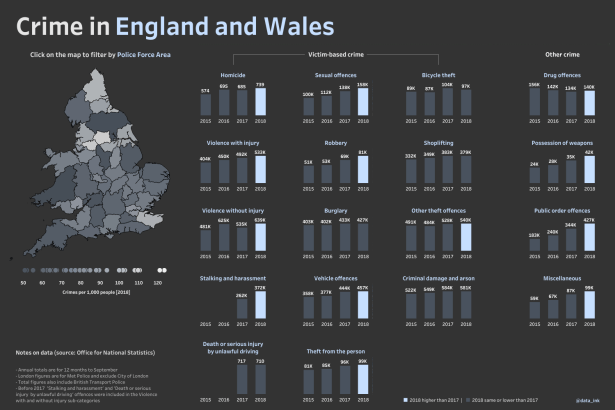
David H.
Crime in England and Wales
Twitter: @data_ink
David O.
The Vice Index
Twitter: @doc_insight
Blog Post: https://scratchinsight.com/2019/01/10/the-vice-index/

Emily K.
The Data Wire
Twitter: @emilykund

Frederic F.
Australian Indigenous Deaths in Custody
Twitter: @fredffery

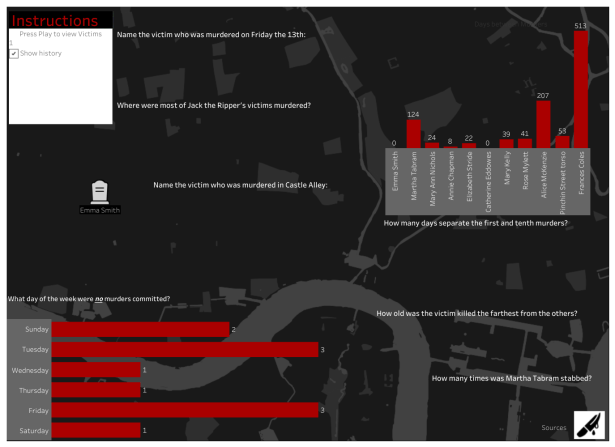
Ginny M.
Jack The Ripper
Twitter: @GinnyMoench
Blog Post: https://tableaulunchbreak.wordpress.com/2019/01/25/my-first-ironquest-submission/
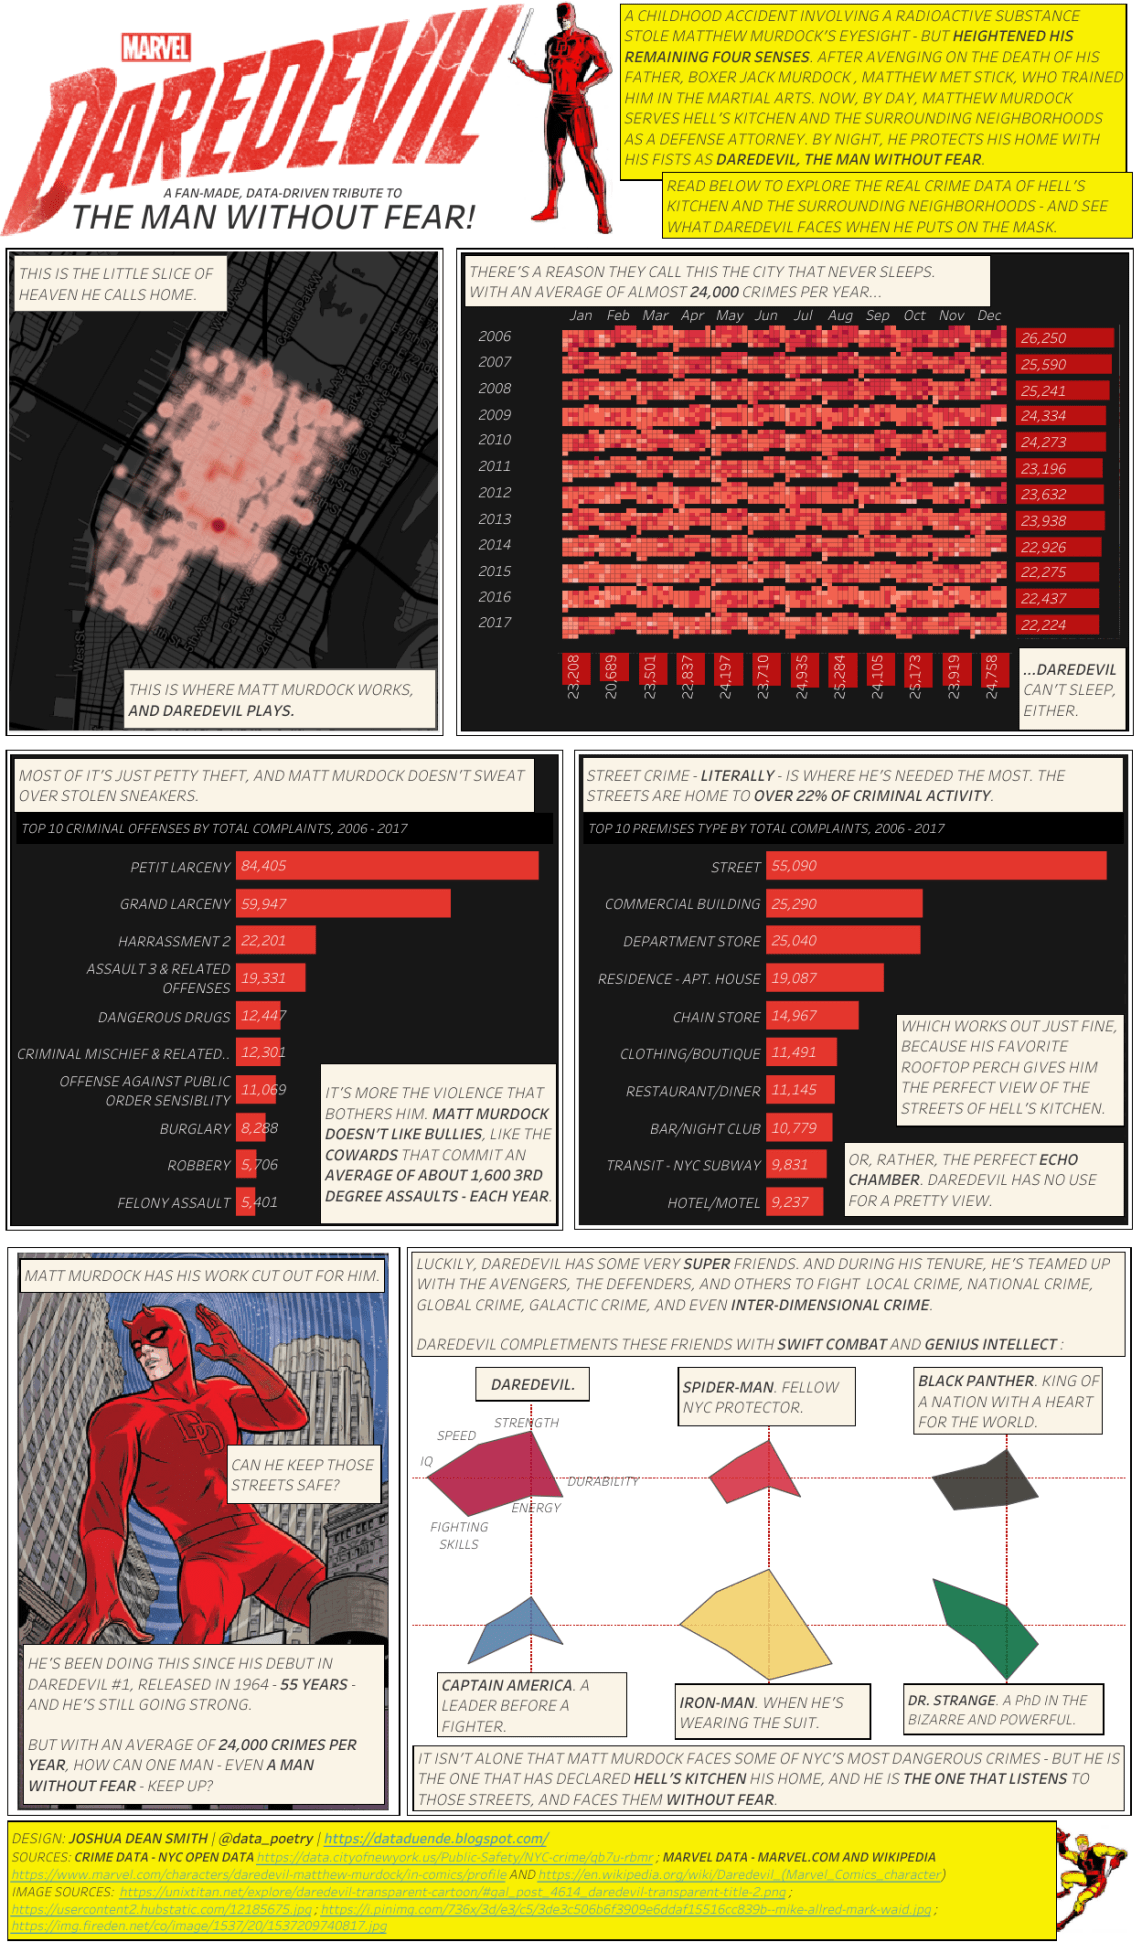
Joshua S.
A fan-made, data-driven tribute to Daredevil; the man without fear!
Twitter: @data_poetry
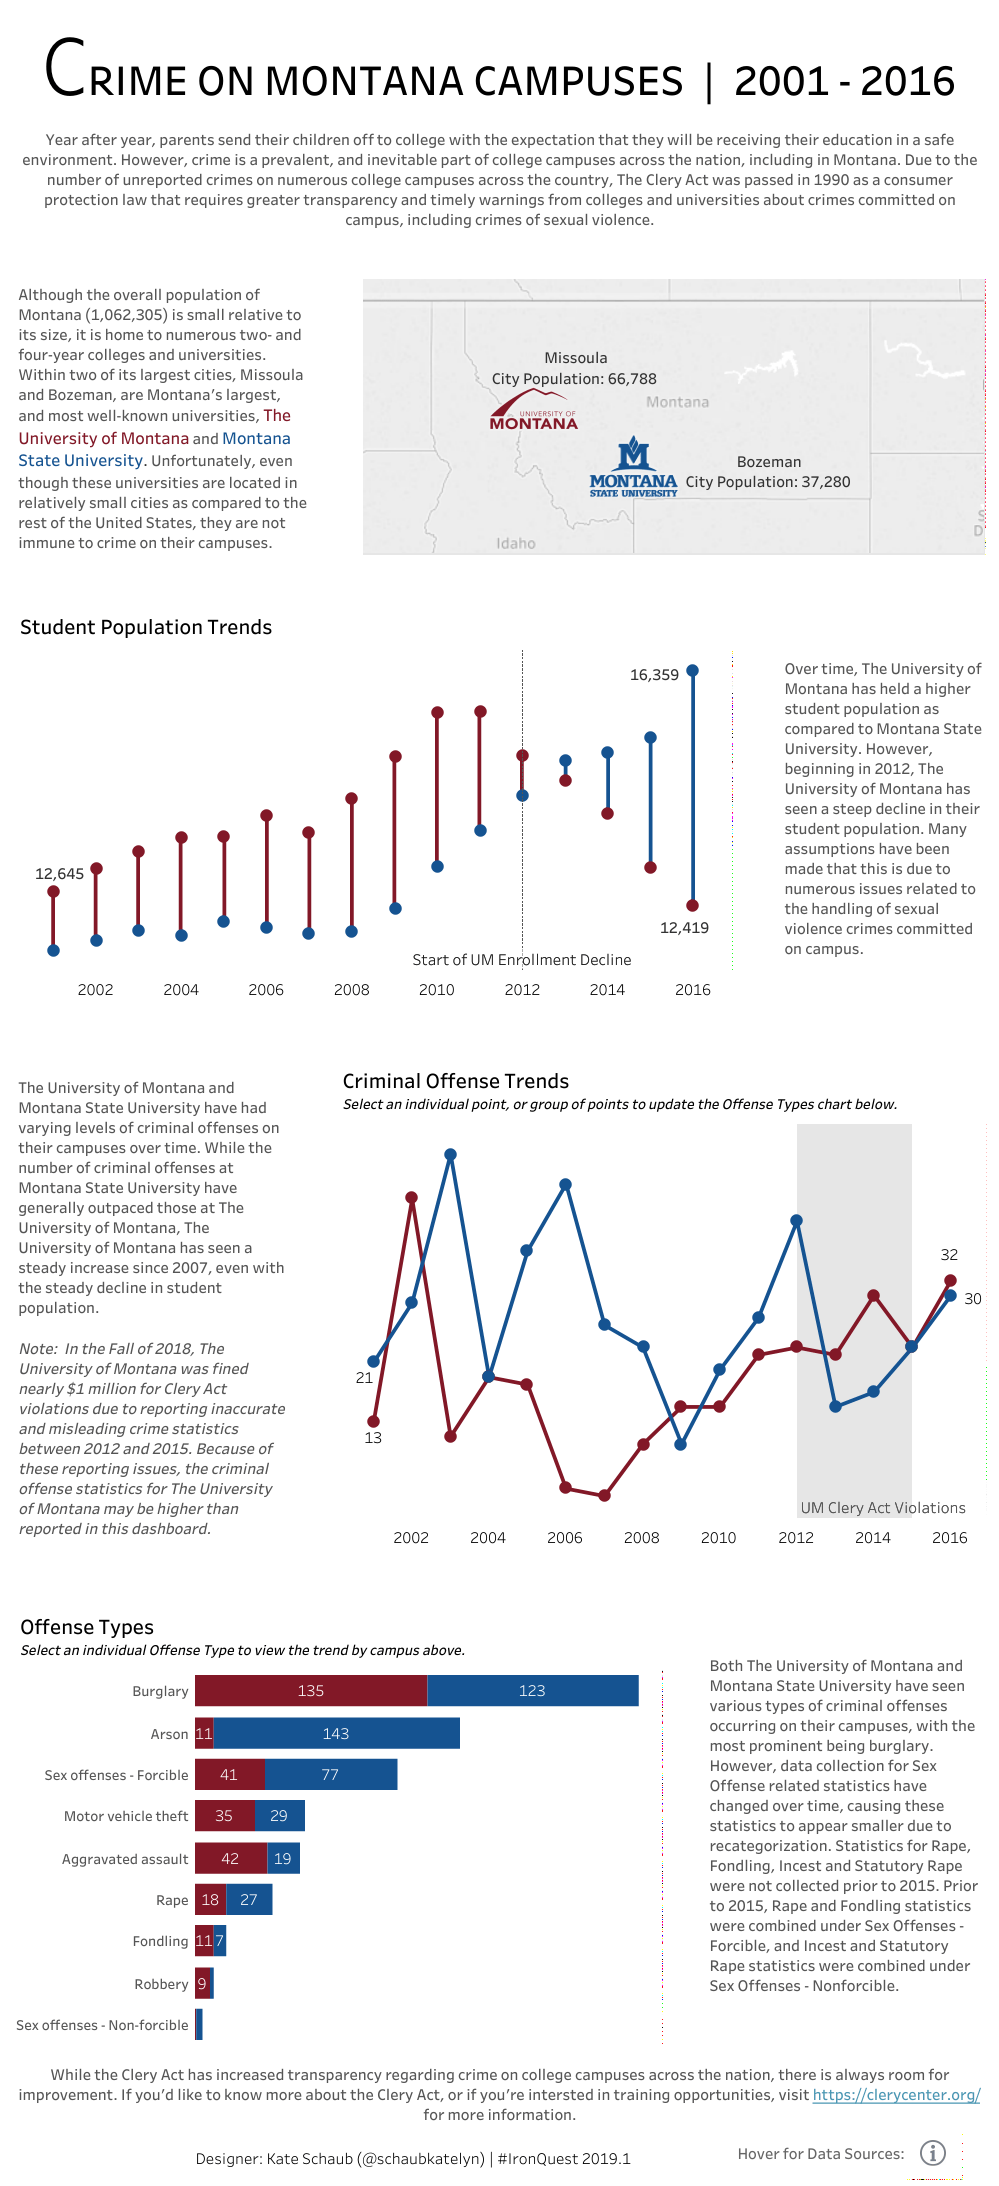
Katelyn S.
Crime on Montana Campuses
Twitter: @schaubkatelyn
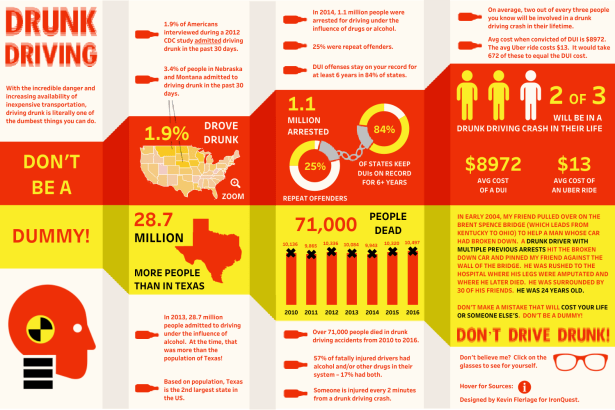
Kevin F.
Drunk Driving
Twitter: @FlerlageKev
Blog Post: https://www.kevinflerlage.com/2019/01/an-infographic-approach-to-ironquest.html
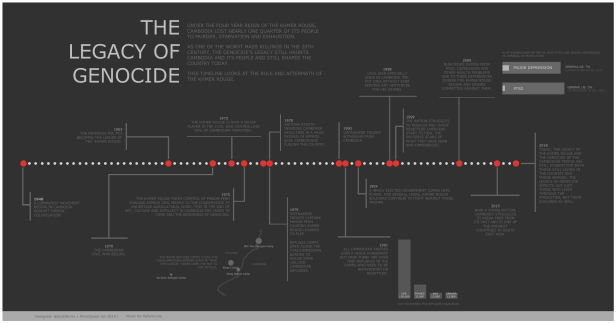
Kimly S.
The Legacy of Genocide
Twitter: @ScottKimly
Luke S.
Stop and Search: A Hidden Problem in Minneapolis
Twitter: @LukeStanke

Meera L.
Identity Theft in the US
Twitter: @LosaniMeera

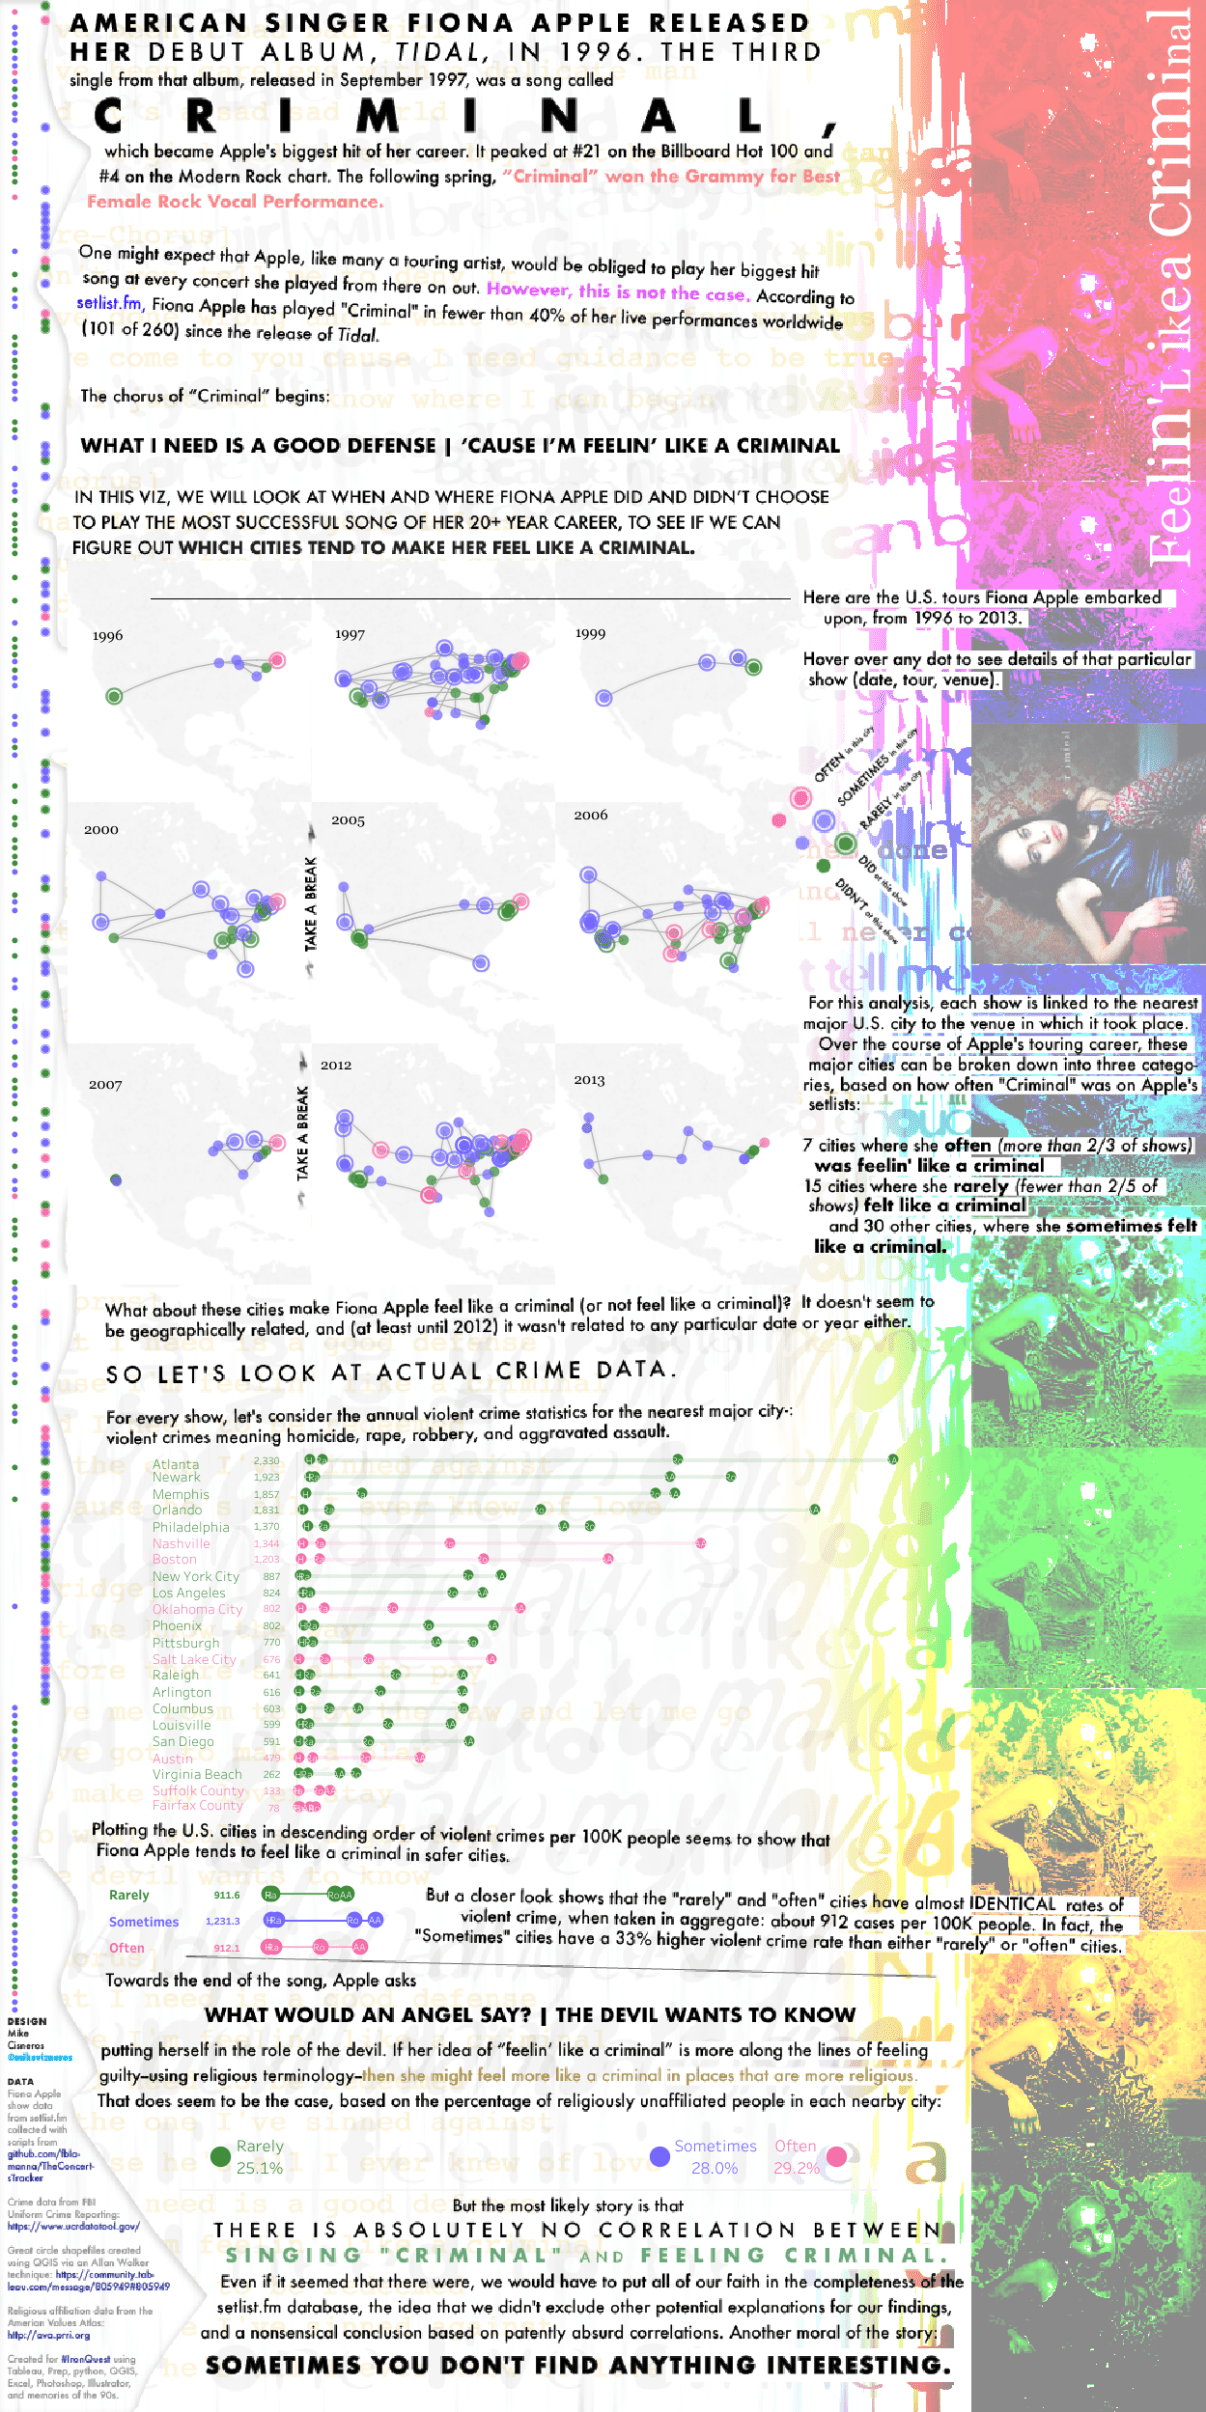
Mike C.
Feelin’ Like a Criminal
Twitter: @mikevizneros
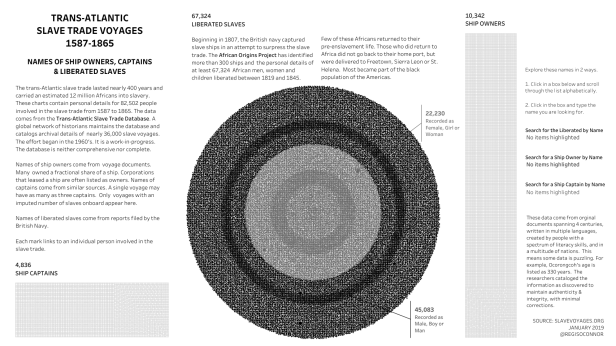
Regis O.
Trans-Atlantic Slave Voyages: Names of Ship Owners, Captains & Liberated Slaves
Twitter: @RegisOconnor
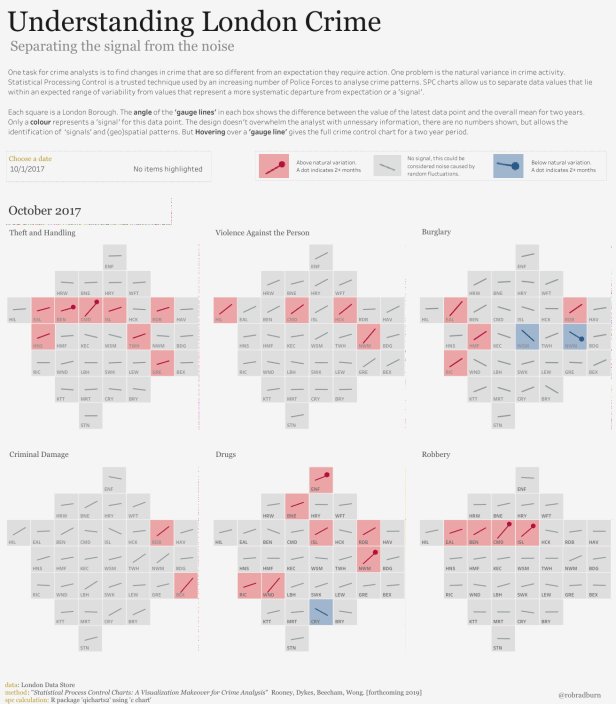
Rob R.
Understanding London Crime
Twitter: @RobRadburn
Sarah B.
Murder in New Zealand
Twitter: @sezbee

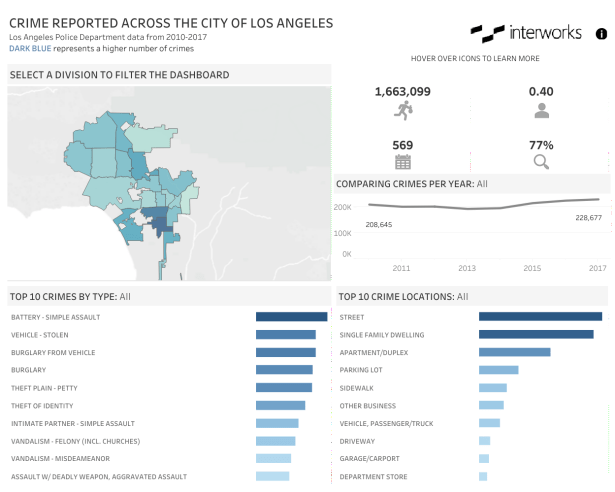
Sarah D.
LAPD Crime Incidents by Division 2010-2017
Twitter: @SarahPDorfman
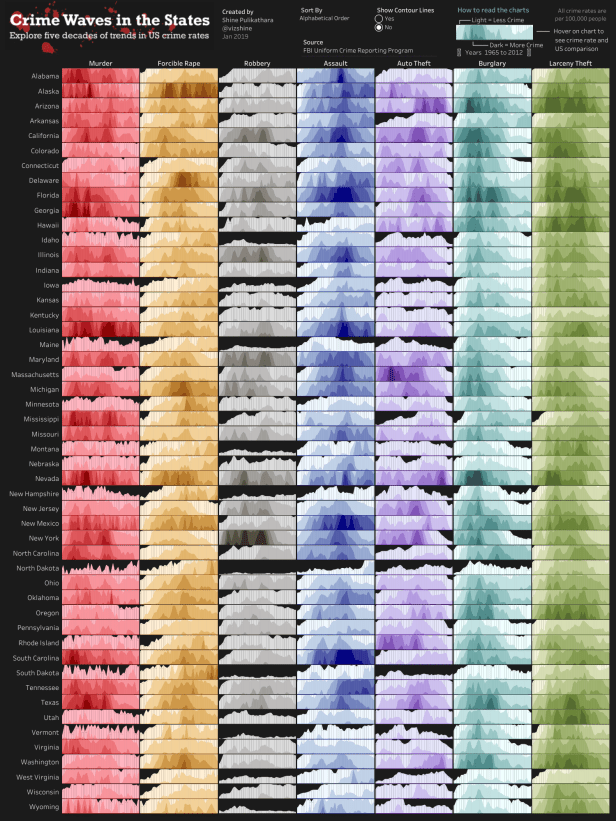
Shine P.
Crime Waves in the States
Twitter: @vizshine
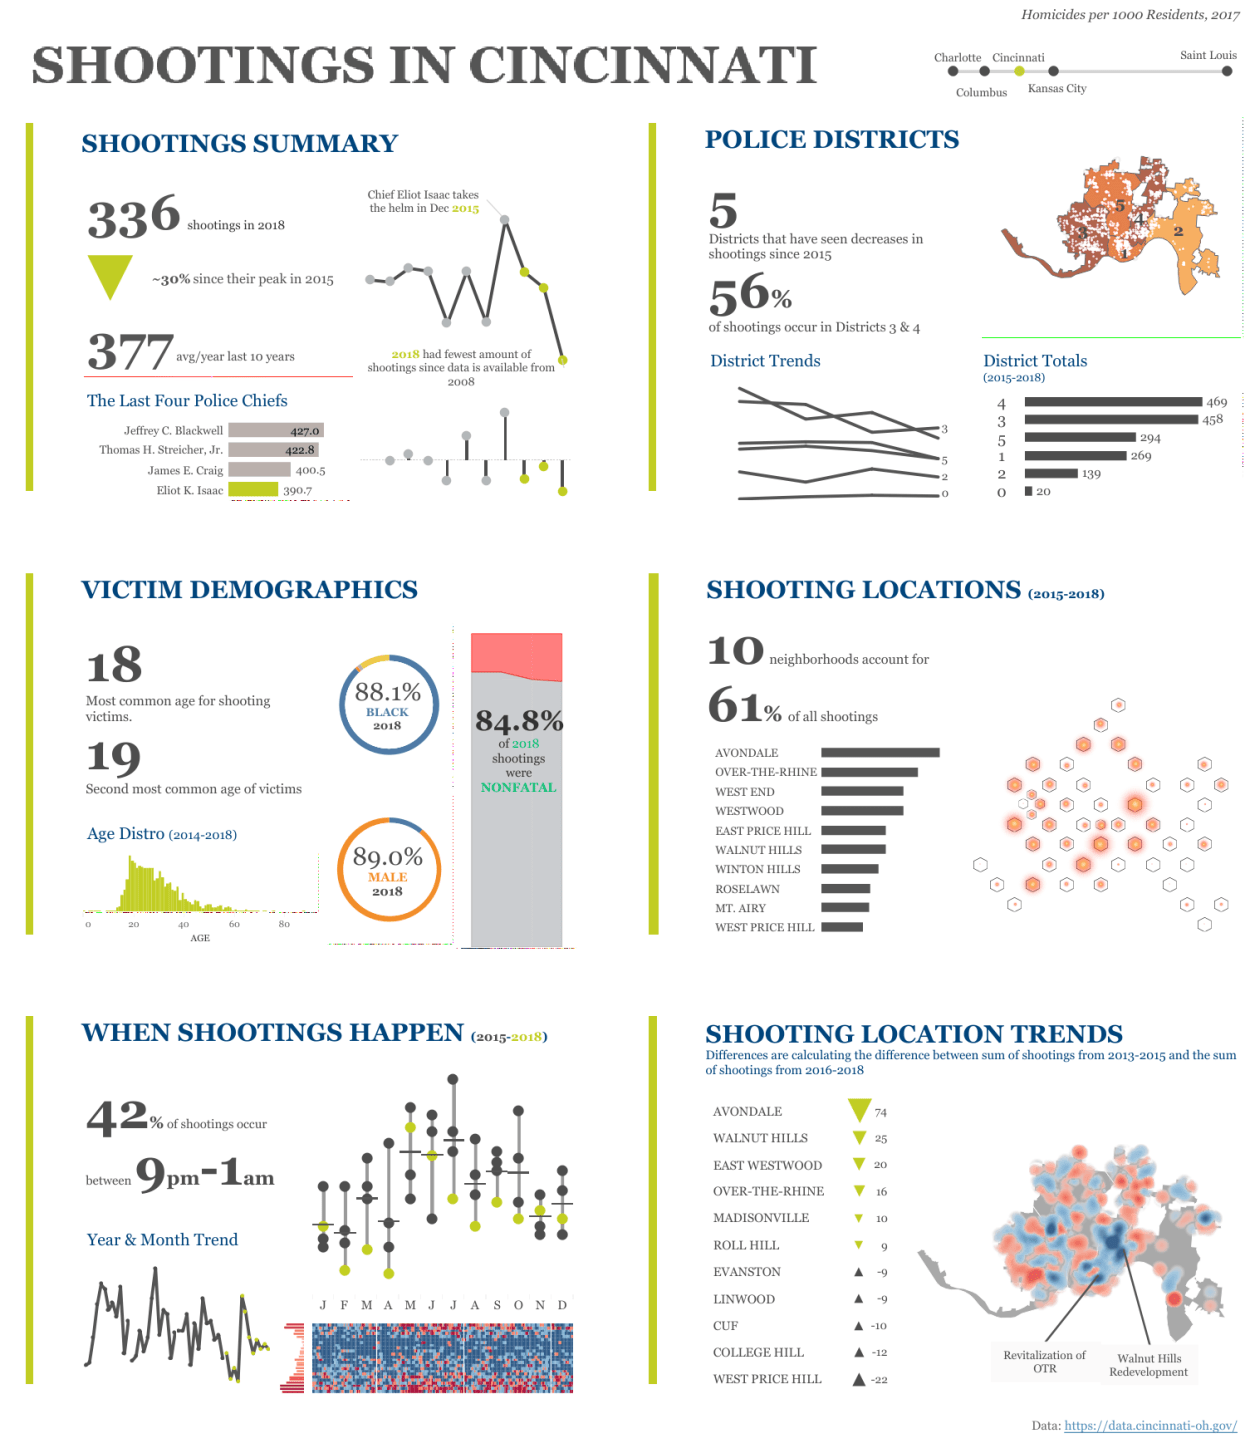
Spencer B.
Shootings in Cincinnati
Twitter: @JSBaucke
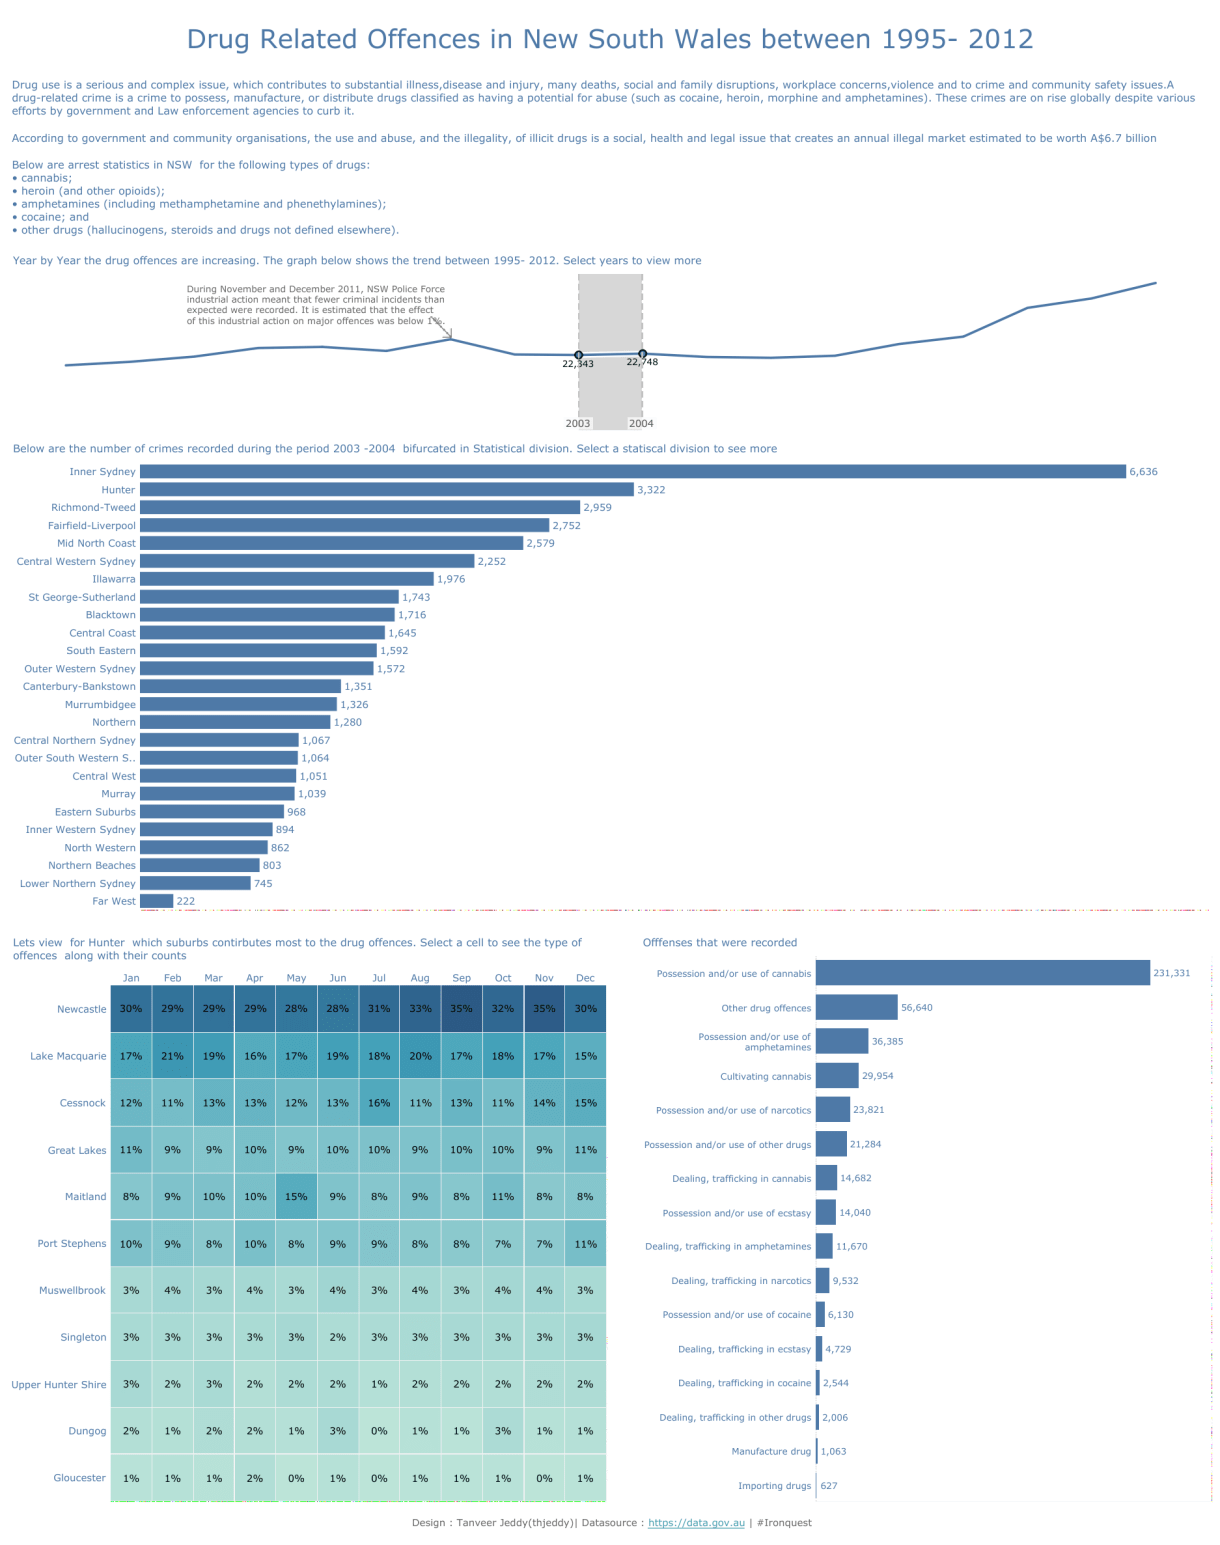
Tanveer J.
Drug Related Offences in New South Wales between 1995-2012
Twitter: @thjeddy
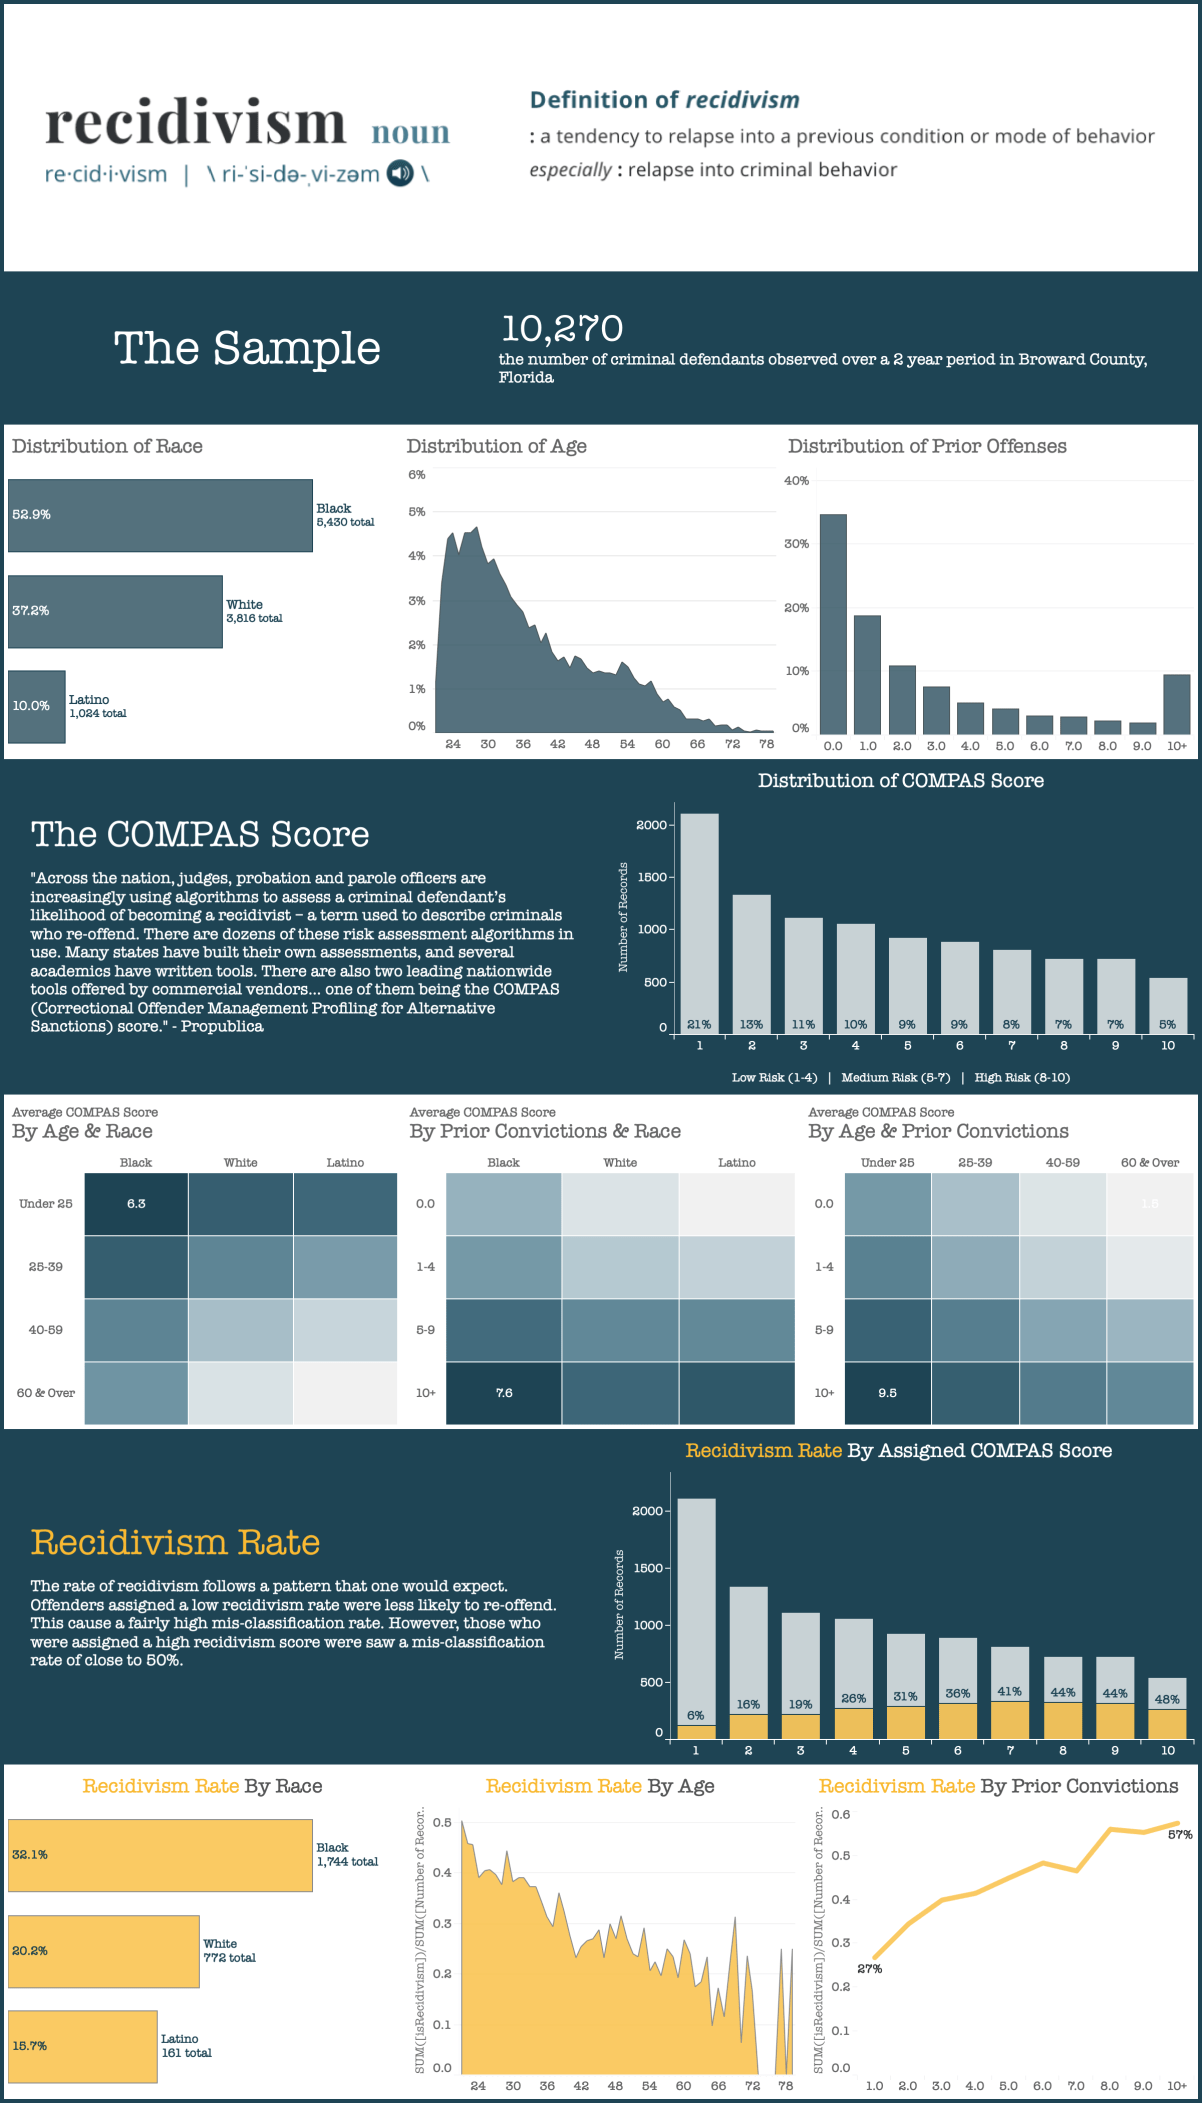
Tim L.
Recidivism Rates
Twitter: @TimFromVelocity
Vivian G.
Global Terrorism Trends, 2012-2015
Twitter: @Vivfiona

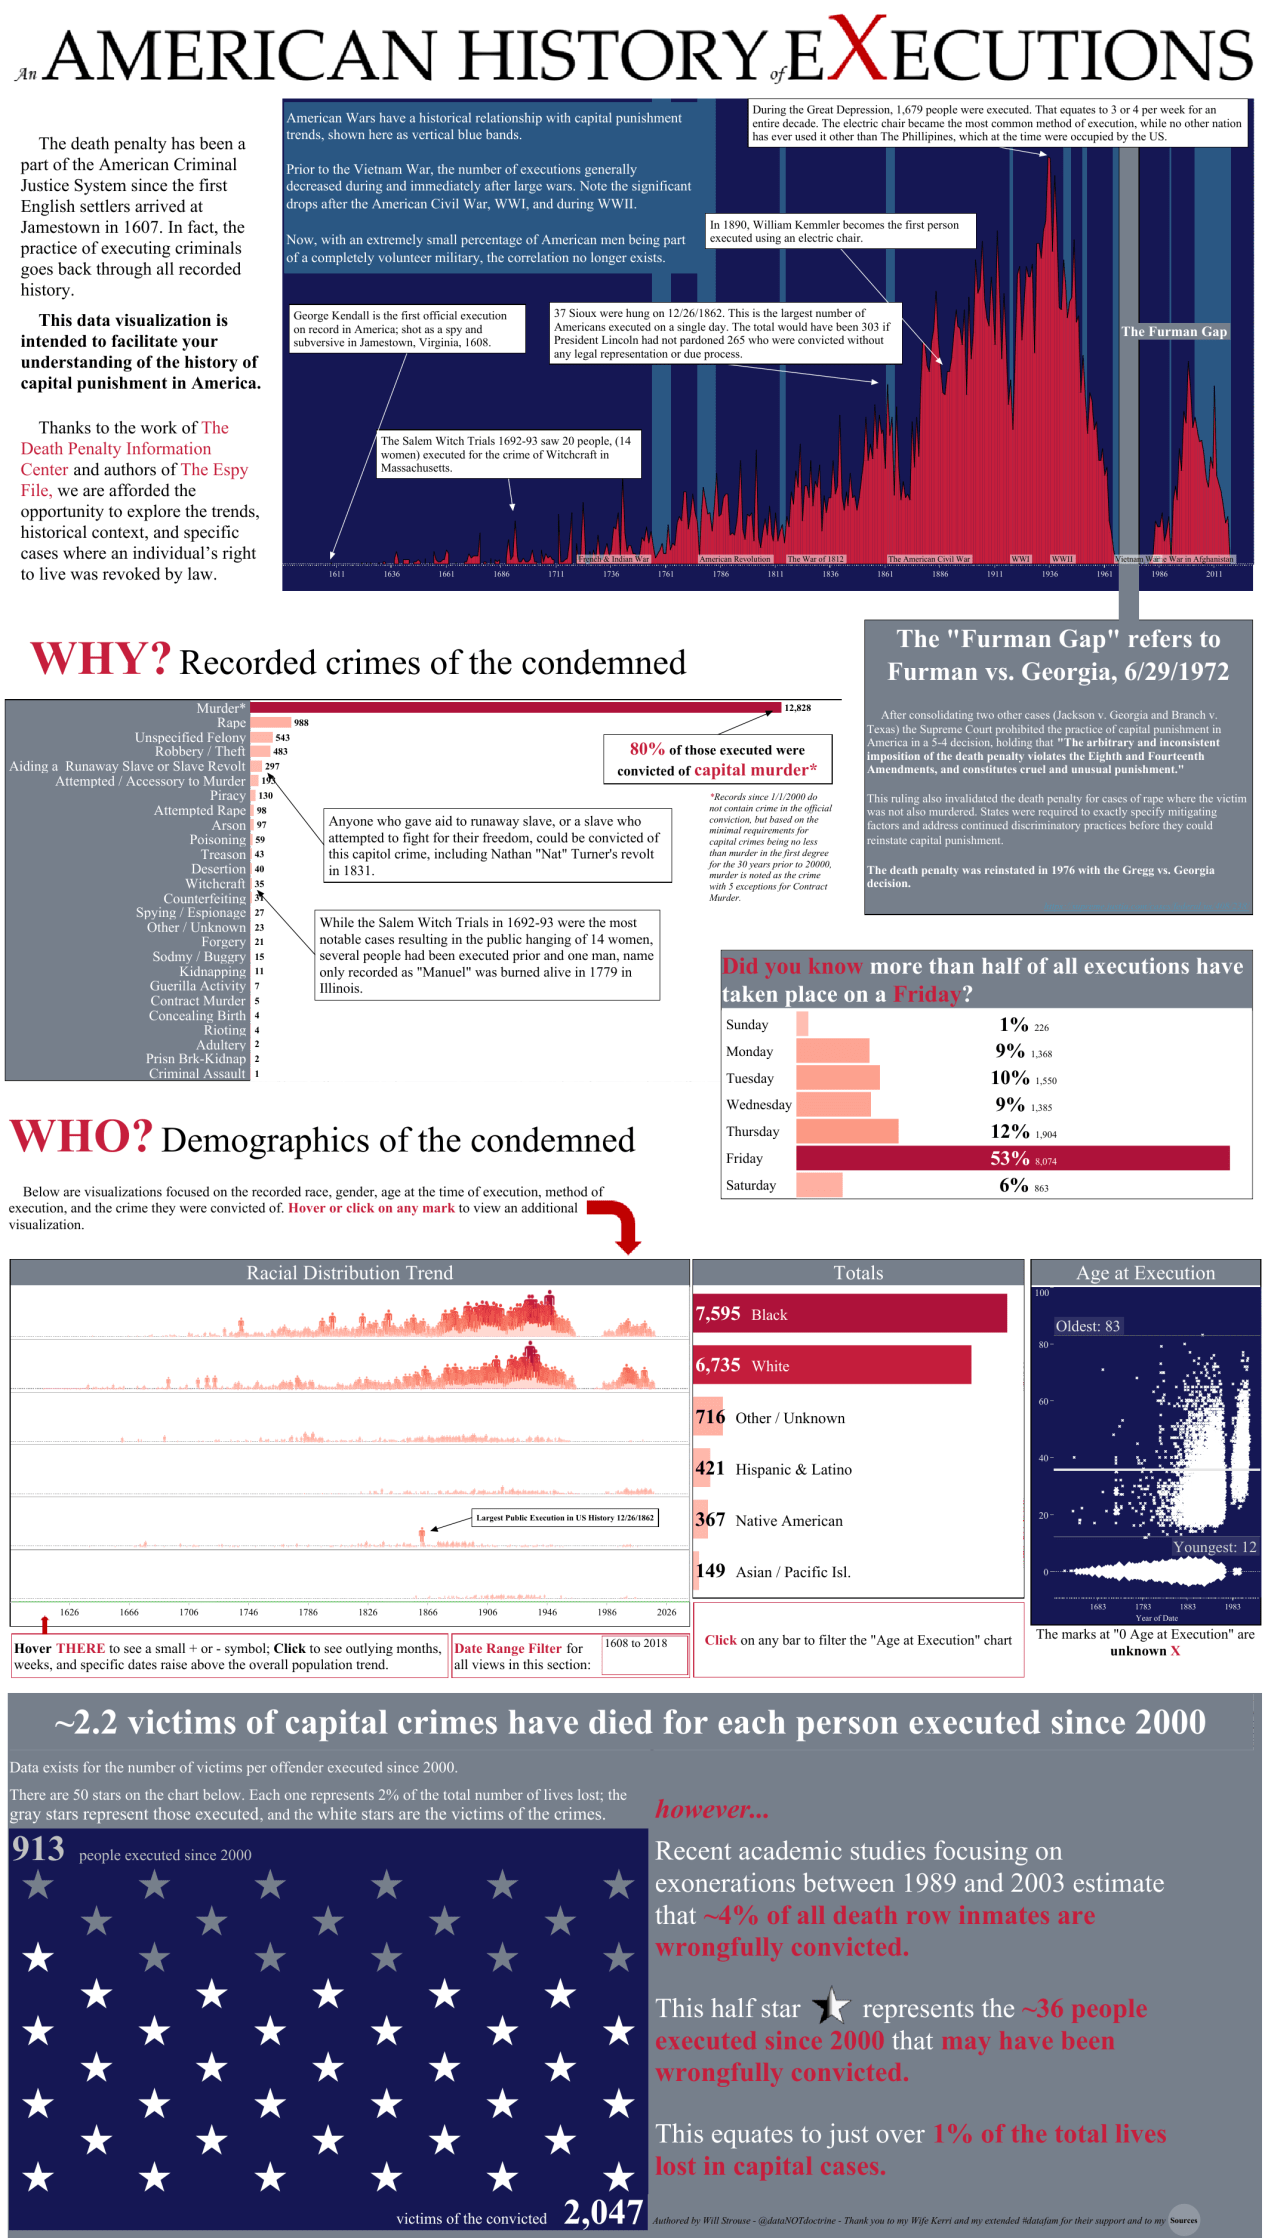
Will S.
An American History of Executions
Twitter: @dataNOTdoctrine
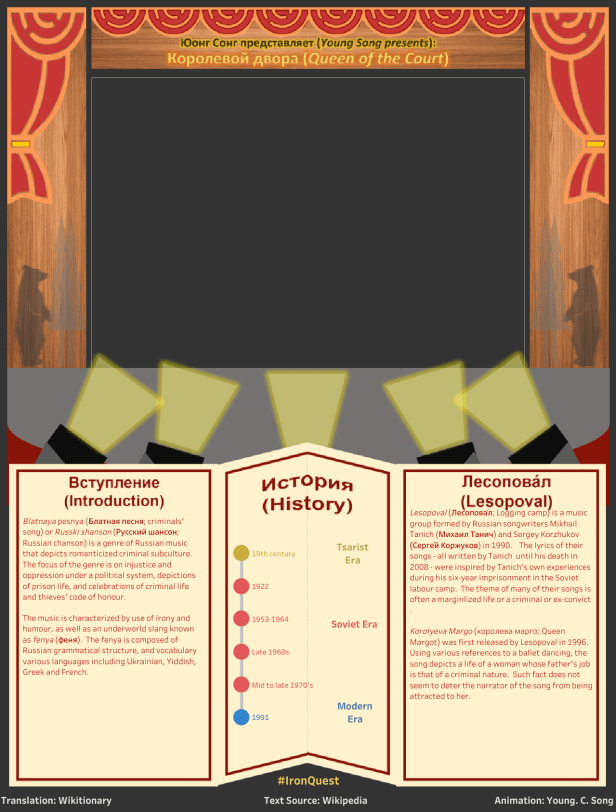
Young S.
Koroleva Dvara (Queen of the Court)
Twitter: @ycsong21
Click ‘like’ below if you’ve enjoyed this post. This helps to let me know that the time it takes to pull this together is worthwhile!
The next monthly theme is Business-Style Dashboards and will run until midnight PST on 3rd March 2019. Follow the hashtag #IronQuest on Twitter and check out the Iron Quest section on my blog for more info, including more details on the next challenge.
Thanks for reading.

This post is amazing. Looking through all the different types of entries is inspiring. I look forward to February Iron Quest post. I’m so glad you started this.
LikeLiked by 1 person