When I first participated in Iron Viz in 2018, I reached out to a few friends in the community for feedback. Ironically, I exchanged feedback with Klaus Schulte that year and we later ended up facing each other in the #IronViz Europe final! Regardless, the feedback I received that year was invaluable. It helped provide me with confirmation that I was on the right track whilst helping me to look at my viz with a fresh pair of eyes. Often when we spend a long time looking at a viz, we can become stuck creatively, or we fail to recognise the limitations of our work. This is where feedback from others is invaluable.
I’ve long-admired those community members that support others through the feeder contest by offering feedback. In 2018, I recognise that I was in a privileged position since I knew several community members personally and felt comfortable reaching out to them for feedback. However, as a newcomer to the community, you’re unlikely to have a support network like this. While I encourage people to seek feedback on their vizzes from others (in general, not only for Iron Viz), it can be difficult to know where to start and many people aren’t comfortable in reaching out to strangers. Thankfully, there are initiatives like #VizOfficeHours, led by Michelle Frayman and Zak Geis that help with this.
Back in 2021, instead of running #IronQuest during the Iron Viz feeder contest, I decided to join forces with other leaders from across the community to establish an Iron Viz feedback initiative. I threw the initiative together quickly, using Calendly as a platform to enable participants to book feedback appointments. While I could have done this by myself, I knew I could only support a handful of people alone. I, therefore, rallied together some of my former #IronQuest co-hosts and together, we worked with 20 participants to provide feedback on their feeder entries, helping them to refine their vizzes and maximise their chances of scoring highly in the contest. The initiative was a success and many participants subsequently reached out to us, mentioning how the feedback had helped them. Given its initial success, I decided to host the initiative again this year.
Initiative Overview
This year, we brought together a team of community leaders, former Iron Viz finalists and Tableau Ambassadors to serve as reviewers to support the initiative.
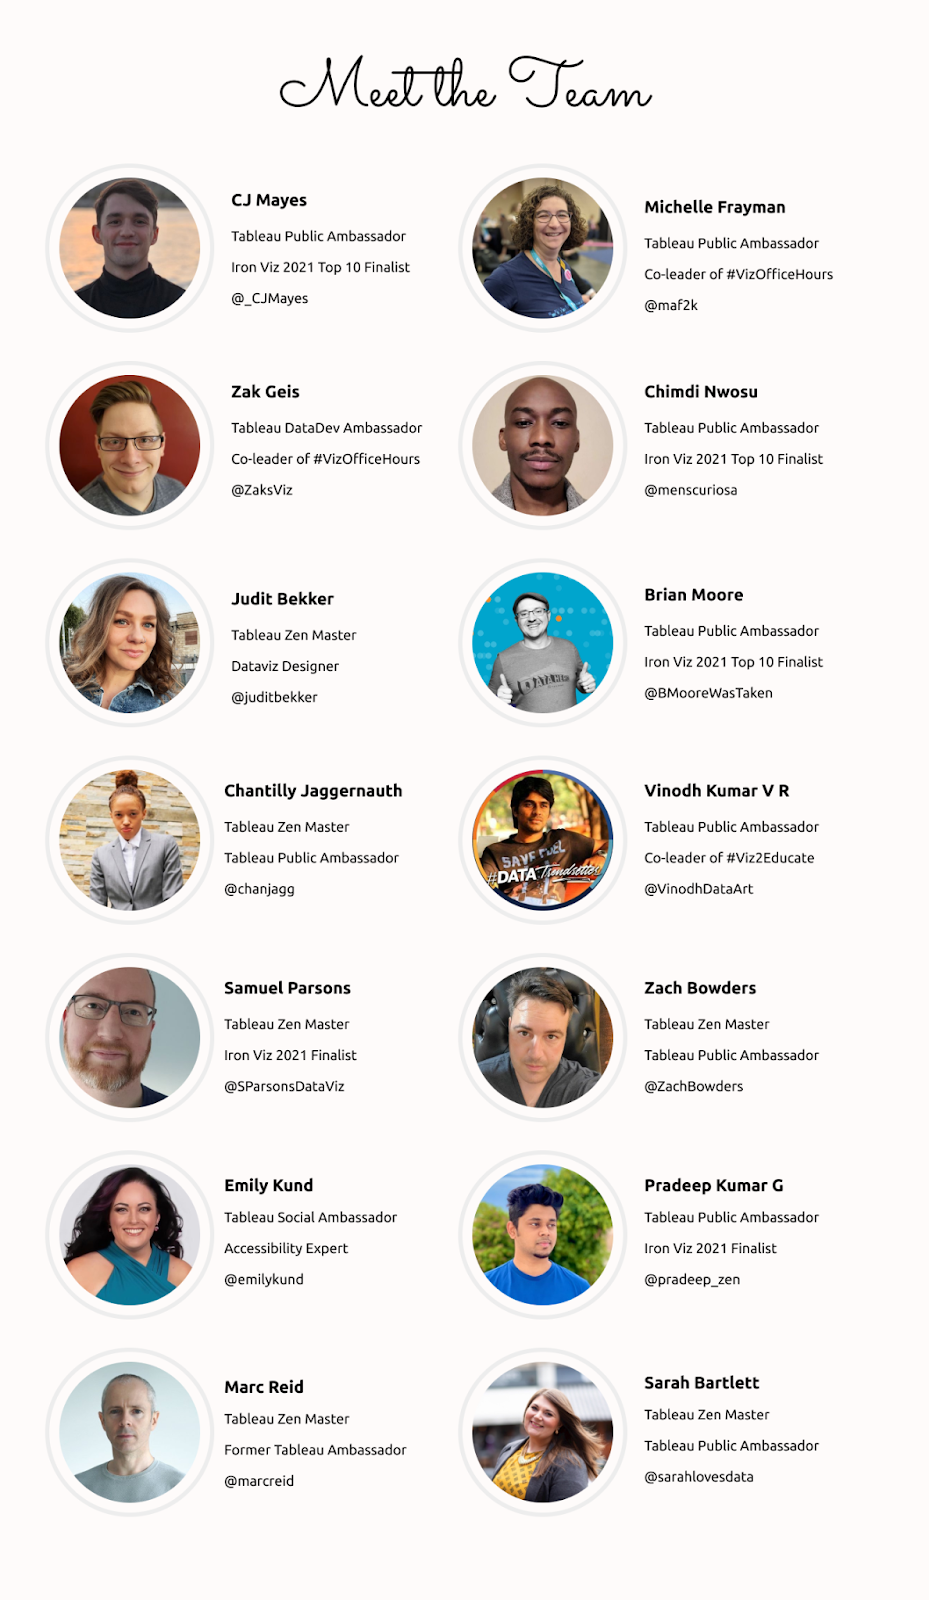
The review team were based in countries across the globe, spanning the Americas, EMEA and APAC. This helped to ensure we could cover all time zones, as well as offer a variety of different perspectives in our feedback. I am incredibly thankful for the review team and I couldn’t have done this without their support! Many sat through back-to-back feedback sessions, sometimes for hours at a time or late at night.
Together we supported 43 Iron Viz participants through 49 x 15-minute feedback sessions. This equates to over 12 hours of feedback! In reality, it’s actually much more than this as many sessions extended beyond their initial slot, plus we often continued feedback conversations via social media after the initial review.
The participants we met with spanned all Tableau experience levels, from complete beginners to experienced users. 63% had participated in the contest before, while the remaining 37% were first-time participants.
Thoughts from the Review Team
To support this blog post, I asked the feedback team to answer a series of questions to help gather our collective thoughts and perspectives on the feedback sessions.
Personally, I really enjoyed the feedback sessions I attended. It was great to have the authors walk us through their work, often describing their chosen topic with such passion. It’s so rare we have opportunities like these given we mainly consume vizzes designed by the community through Tableau Public, in isolation. Brian agreed, stating that he enjoyed getting to hear in-depth descriptions about each person’s process with their entry, why they chose the topic, and why it was important to them. He said:
“It’s a really cool ‘behind the scenes experience that you don’t usually get when just viewing entries on Tableau Public”
One of the reviewers even likened the experience to ‘attending a premier show of a much-anticipated movie’!
We all agreed that the feedback sessions provided us with the opportunity to meet new people, and speak to people that we were familiar with through the Tableau community but had never connected with before. This applies to the review team as well since many of us had never spoken to each other on a call or in-person before.
As this years’ feeder contest theme was ‘Visualizing the Arts’, it didn’t come as a surprise to see a lot of participants decide to build vizzes analysing the works of famous painters. However, thanks to the broad theme, the variety of topics covered in the vizzes were far broader than simply painters and music artists. CJ said:
“I particularly enjoyed the range of topics that people consider art. With art, not having a strong definition – the way people interpreted it through beauty, emotional power and other creative means was exciting to see. When you get a small insight into why that art impacts them as a person, it’s really refreshing to engage with”.
And it was that personal connection to the subject matter that I found to be particularly compelling. In some of the sessions I attended, the author had built a viz on a topic that the other reviewers and I were not familiar with. However, this served as a great test. Could we, as novices, understand what the viz was telling us without any prior knowledge, simply by the context provided in Tableau? If we could, it was a good indication that the viz provided enough subject-matter context for the audience to understand.
Common Feedback Points and Viz Pitfalls
Throughout the feedback sessions, there were a couple of areas for improvement that we witnessed multiple times. If you are considering entering #IronViz next year, these are points you’ll want to consider when building your viz.
Use of Imagery
Given the Arts theme, it perhaps wasn’t surprising that many authors chose to incorporate images into their work. Images can be used to enhance the viz design and support the overall story. However, images should be selected with care. As a reminder, Section 4.C. of the Iron Viz 2022 contest rules states:
“the Entry must not contain any material that violates or infringes upon the rights of any third party, including without limitation any copyright, trademark or right of privacy or publicity…”
Before choosing an image, ensure you have the right to use it, being careful not to select images that could infringe copyright. Sites such as Pixabay, Pexels and Unsplash offer images covered by licences that state they can be used for free, for both commercial and personal use.
Incorporating Images into the Design
Continuing with the topic of imagery, remember that Iron Viz is an analytics competition that uses Tableau. Images can be used to complement your analytics, but they should always be secondary to the analytics. If your images take up the majority of your viz, you might want to reconsider your design. CJ touched on this point here:
“The type, size and positioning of still images can make or break a visualisation. Where individuals used images as supplementary aids, it worked really well! But on the flip side, some images can overpower the analytical focus of some visualisations”.
Storytelling, Context and Narrative
The Iron Viz scoring criteria focuses on design storytelling and analysis but through the feedback sessions, we noticed that some vizzes were weaker in one or more of these areas; namely storytelling. A viz that looks good but lacks storytelling and analysis is unlikely to score highly. Referencing the sessions he attended, Marc said:
“I often encouraged more analysis and storytelling as well as ensuring the viz gave a good introduction to the (sometimes niche) topic”.
Chimdi also mentioned the importance of creating a narrative to communicate with the audience. Something as simple as explaining the findings of your analysis, in words, and calling out what surprised you, can be an effective approach. Michelle offered a great tip for anyone looking to strengthen the narrative in their viz:
“My favorite piece of advice is to write yourself into the viz. It sometimes felt like people are so close to their topic and had a great passion for it but I often didn’t know anything about it. When someone includes their perspective, it is easier to connect. I also think it improves the storytelling”.
This is something I frequently encouraged also. Don’t be afraid to explain why the topic is important to you or call out data points that you are more closely affiliated with. For example, if you were doing a viz on the most popular movies, you could highlight which ones are your favourites as a way of writing yourself into the viz.
Context is also important here. When you have a vested interest in something or are an expert on a subject, we have a tendency to brush over the starting context as it’s easy to take it for granted. As CJ mentions,
“From a storytelling perspective, this is like starting halfway through a story and hoping your audience will know what you’re talking about. I’d recommend people really plan out what they want to show as a start, middle and end and consider what you want the viewer to take away once they finish looking at the viz”.
Designing for Accessibility
In an effort to create a stylish design, it can be tempting to use small font sizes, non-standard fonts and lighter tones. However, these approaches can often lead to accessibility challenges. Always ensure that your text is readable. Size, contrast and spacing all contribute to this. A great resource to learn more about accessibility in data viz is Chartability, created by Frank Elavsky.
Feedback from Participants
To help support this post, I also reached out to those who had signed up for feedback sessions to gather their feedback on the overall experience. I know some people are hesitant to request feedback on their work, for various reasons. That’s perfectly understandable and I think it’s only natural. It can be difficult to handle criticism of your work, especially when you are highly invested in it. However, I’m grateful for those that grasped the opportunity and from the feedback we received in response, I believe it was a positive, valuable experience all-round. I hope the comments listed here will encourage more people to seek feedback on their Tableau vizzes and highlight the benefits of doing so.
From the participants perspective, I wanted to understand what prompted them to sign up for feedback in the first place. Overwhelmingly, the reasons for signing up were similar amongst many participants;
- to seek new perspectives and avoid ‘working in a bubble’,
- to help ensure vizzes were meeting the scoring criteria,
- to help stay on track with the deadline and have something in the diary to ‘help remain accountable’.
Brittany summed it up well here:
“Last year I didn’t solicit feedback until very late, and that was something I wanted to change this year. With Iron Viz coming quicker in the year than I expected, I wasn’t as ‘ready’ with my ideas. When I signed up for feedback, I was at a spot where I was feeling pretty stuck and I was hoping that fresh eyes on my viz would help to point out things I hadn’t considered”.
And in terms of the feedback itself, we received some wonderful feedback comments, a few of which I’ve included below:
“I got some really helpful design tips and I felt much more confident in making readable graphs. Sometimes all you need is for someone to say ”oh have you tried this?” because you didn’t know that was possible”.
“It was really inspiring to talk about my viz and my concept to someone who was interested in the data and experienced with the competition. Since this was my first long-form viz and I took a little bit of an unusual spin on the theme, having the feedback that this was an appropriate and engaging topic made it easier to find the energy to finish the build. In addition to the accountability and the inspiration, the review team suggested another take on an interactive feature that I had described (but not yet built). My session was four days before the qualifier deadline, so the feedback on which sections would have the most impact really helped me focus my work”
“The feedback helped me a ton! I’m new to Tableau and the team were kind, patient, and honestly just gave great advice”.
“The feedback session really felt like a safe space to get actionable feedback. It felt like a ‘no judgement’ zone and I came away from the session feeling excited again about what I was working on. I would highly recommend folks sign up for sessions in the future, whether to get feedback or give it to others!”
Thank you to everyone who participated in this initiative! I’m pleased we could help support you.
Congratulations to everyone who entered Iron Viz; whether you utilised the feedback initiative or not! You no doubt challenged yourself, learnt something new and hopefully felt proud of what you achieved. In my eyes, that’s a win in itself, irrespective of where you score in the overall competition. I can’t wait to see the submissions gallery and browse through all of the entries!
If you are craving more Iron Viz-type challenges, be sure to check out #IronQuest! We just launched a brand-new project which will run until Sunday, 13th March. Find out more here.
Thanks for reading.
