For the month of March, the #IronQuest theme was maps. This was slightly different to any previous #IronQuest in the sense that we focused on a specific chart type, rather than a topic.
I chose the map theme to give participants the opportunity to experiment with some of the newer mapping features in Tableau such as buffer calculations, or even experiment with map styles in Mapbox. Many users don’t have the opportunity to use the spatial features in Tableau as much as they would like so I thought this would give participants an excuse to practice.
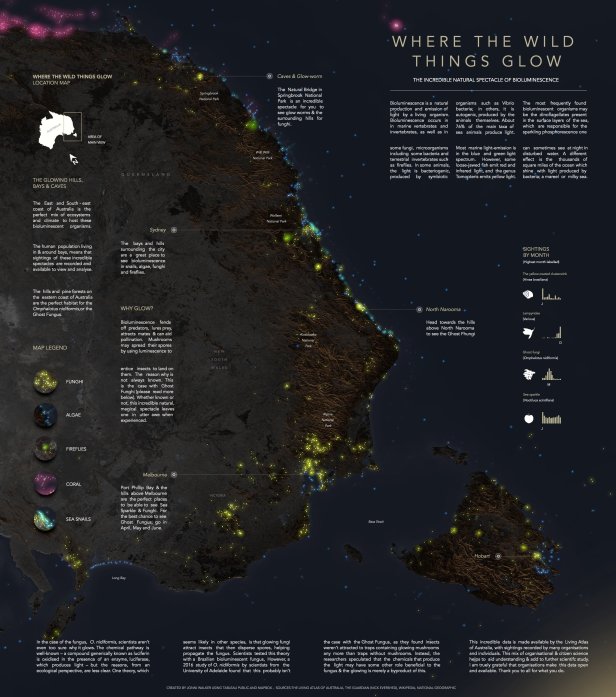
I was honoured to join forces with Tableau-Mapbox guru, Jonni Walker this month. Jonni is passionate about data visualisation and his creations using Mapbox and Tableau are print-worthy pieces of art. His work has been published in Andy Kirk’s “Best of Data Visualisation” round-ups multiple times and in Andy’s words, “He is doing things in Tableau I’ve rarely seen before with such creativity and with an aesthetic you might normally associate with that of centres of excellence like National Geographic magazine”.
Below is an example of one of Jonni’s recent vizzes built using Mapbox and Tableau:
We received a total of 39 submissions for this round making it the most popular round in #IronQuest history! What’s more, 41% of entrants were first-time #IronQuest participants in this round! It’s always great to see new people getting involved in projects like #IronQuest and the Tableau Community.
Given that the topic was completely open this month, it was interesting to see the diversity of themes and data sets covered in the submissions.
Some participants opted to re-tell historic tales;
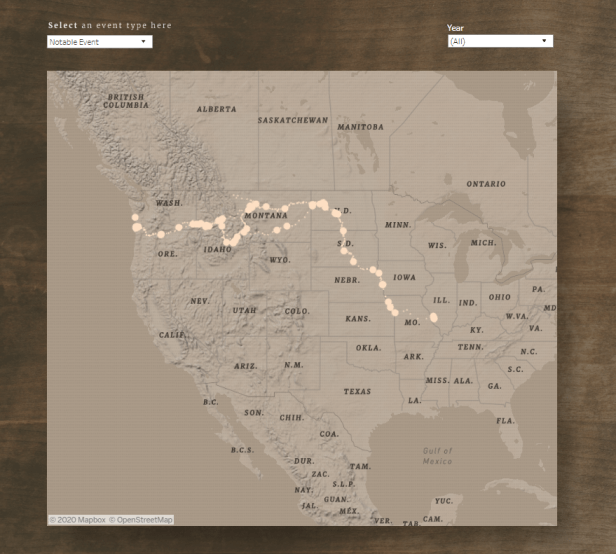
David Borczuk painstakingly investigated, consolidated, documented, and analyzed data and journal entries to visualise Lewis and Clark’s journey across the American Midwest, starting in 1803:
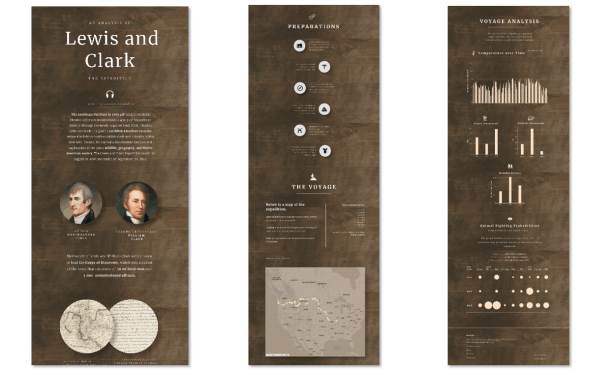
David mapped the expedition using a custom map background built in Tableau, including details of notable events which Lewis and Clark recorded along the way accessible in the tooltips:
Other participants used the opportunity to shed light on pressing issues around the world;
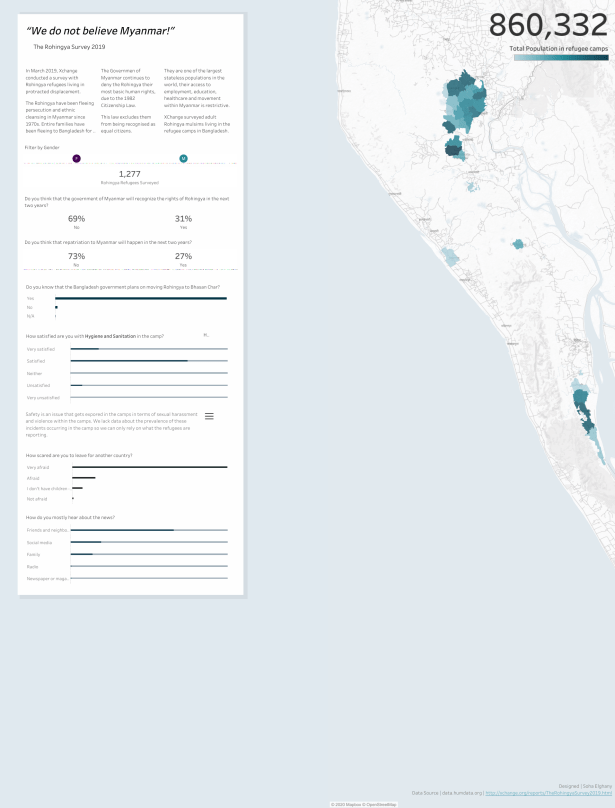
Soha Elghany was inspired by the recent news of Amal Clooney seeking justice for Rohingya Muslims at the UN’s court so decided to visualise The 2019 Rohingya Survey.
The Rohingya people are a stateless Indo-Aryan ethnic group who reside in Rakhine State, Myanmar. In August 2017, a deadly crackdown by Myanmar’s army on Rohingya Muslims sent hundreds of thousands fleeing across the border into Bangladesh. They risked everything to escape a military offensive which the United Nations later described as a “textbook example of ethnic cleansing”. In January 2020, the UN’s top court ordered the Buddhist-majority country to take measures to protect members of its Rohingya community from genocide.
The massive numbers of refugees who fled to Bangladesh in 2017 joined hundreds of thousands of Rohingya who had fled Myanmar in previous years. Kutupalong, the largest refugee settlement in the world according to UNHCR, is home to more than 600,000 refugees alone.
In this visualisation, Soha built a custom map in Mapbox to indicate the location and population density of the Rohingya refugee camps in Myanmar. She then overlaid this with findings from the Rohingya Survey to show the sentiment of the Rohingya muslims living in the refugee camps:
Some participants chose to visualise personal events and stories;
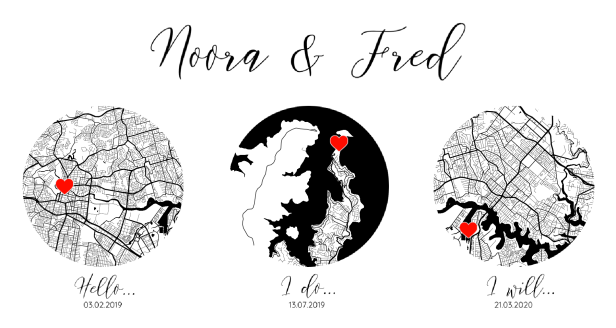
Fred Najjar visualised important milestones in his relationship with his wife using minimalistic maps to show where they met, where he proposed and where they were recently married:
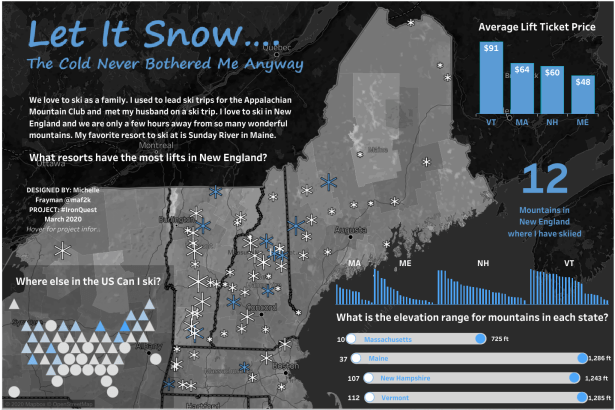
Michelle Frayman focused on her love of skiing by mapping ski resorts in New England, USA and highlighting the resorts she has visited, as well as other interesting data about ski resorts in New England:
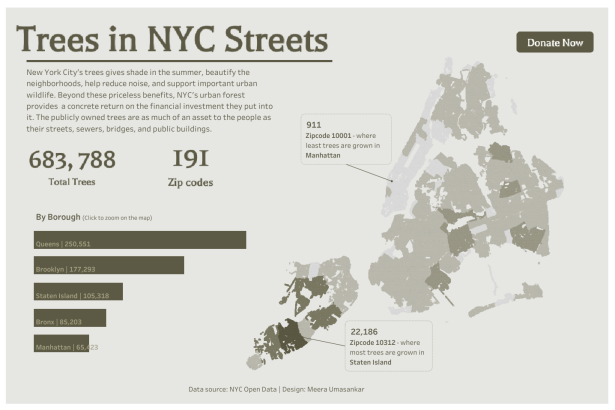
We were reminded that not all maps need a map background layer. Sometimes the data alone is enough. For example, both Kate Schaub and Meera Umasankar visualised data focused on New York City. Neither of them used a map background as their datasets were so rich, readers could easily identify the shape of New York City without the need for an additional background layer.
In Kate’s viz, the building footprints of Manhattan were clear to see:

While in Meera’s viz, the boroughs of NYC are shaded by the number of trees they are home to. Together, these shaded areas form a map of NYC:
Feedback
This month I had the pleasure of teaming up with Jonni Walker and together we provided feedback to those who requested it. We spent almost two hours reviewing 28 vizzes in depth and enjoyed sharing our thoughts and feedback on the submissions.
You can listen to our feedback conversation here. Note: we reviewed the vizzes in alphabetical order by the author’s first name:
Jonni provided some excellent insights into map design and approaches he likes to take when designing maps in Mapbox. I would encourage you to watch the video, even if you didn’t submit a viz as there’s plenty of great takeaways and lots to learn.
Feedback Themes
Whilst reviewing the vizzes together, Jonni and I noticed a few recurring themes. I hope you find these insights and tips useful.
Tip 1: Enable Map Interactivity
Just like other chart types, maps can be interactive or static. Often we design maps which focus on a specific area such as a city or a country and in some cases, interactivity may not be required if the key takeaways are clearly visible without the need to zoom in. In fact, in these cases it’s best to fix your map using the pin icon. However, if there is detail to explore and further insight to be gained from zooming into a map, always remember to enable pan and zoom in Tableau.
To switch on pan and zoom:
- Select your map worksheet on your dashboard.
- From the ‘Map’ toolbar, select ‘Map Options’. This will display the map options on the map itself.
- From the map options list, select ‘Allow Pan and Zoom’.
- Now, even if you close the map options list using the ‘X’ button, users will still be able to pan and zoom with the map.
Tip 2: Mask Out Other Countries
Sometimes we build that are focused on a single country or region. Often in these cases, there’s no need to include other countries in the view. In fact, including them can make the visualisation look unnecessarily busy with too much information. Masking out countries (or styling a specific country) is easy to do in Mapbox. There are some instructions available here.
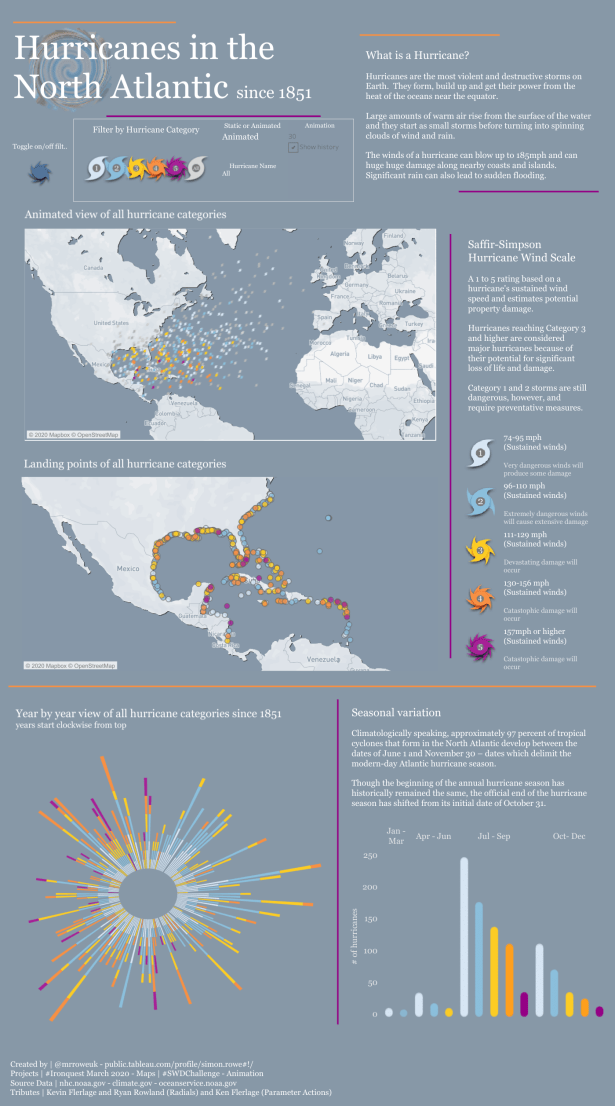
However, countries that aren’t a focus of your visualisation should sometimes be included to provide context or a sense of distance. For example, in this visualisation Simon included the countries in Europe provide a sense of the hurricanes’ proximity to the European coastlines. Our only suggestion here would be to keep the map layers on the European portion to a minimum so they do not become a distraction.
Tip 3: Use Hex or Grid Maps as Alternatives to Choropleths
Choropleth maps are good for comparing country data, especially since we are generally familiar with where countries or regions are located in proximity to each other.
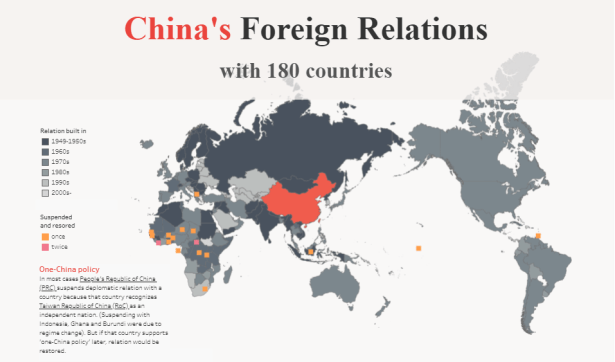
In this example, Wendy used a choropleth map to show the decade each country established a relationship with China. The darker the shade of grey, the longer ago the relationship was formed. This map type makes it easy to identify regional trends:
However, choropleth maps can deceptive since countries or regions with larger land masses tend to have a bigger weight in the map interpretation. This is particularly true with maps that represent populations since some countries or states with large land masses have small populations in comparison to densely-populated areas with smaller land masses.
Grid or hex maps provide an alternative solution. In both map types, each geographical area is of equal size and is placed roughly where we imagine it belongs on a geographical map. These map options aren’t perfect; they take more work to interpret compared to regular maps as locations aren’t always shown where you would expect to find them. However, they do overcome the land mass problem presented by choropleth maps.
In this hex map example, Gary represented the boroughs of London with equally-sized hex shapes. He even accommodated space for the Thames to help readers to interpret the map and included sparklines within each hex shape to show fly tipping trends over time:
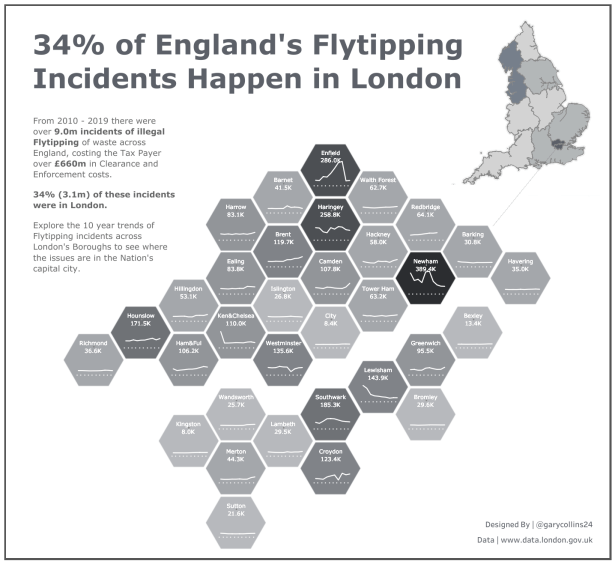
If we compare this to a regular geographical map of the London boroughs, we can see that boroughs such as Bromley and Hillingdon have a large land mass compared to the more centrally-located boroughs such as City or Kensington and Chelsea. If Gary has opted to use a choropleth map to represent this data instead, the smaller boroughs would have been overshadowed by their larger neighbours.

In this example, Rob adopted a similar approach by using a spatial treemap to show land use in England. Each of the 326 English Local Authorities are represented by a 10 x 10 square, and are arranged in it’s approximate geographic position. Each Local Authority is shaded to show the proportion of land use by type. The Local Authority squares are then grouped by region:

The Submissions
THANK YOU to everyone who submitted entries for taking the time to create and share your work! Also, a big thank you to Jonni for being a fantastic co-host.
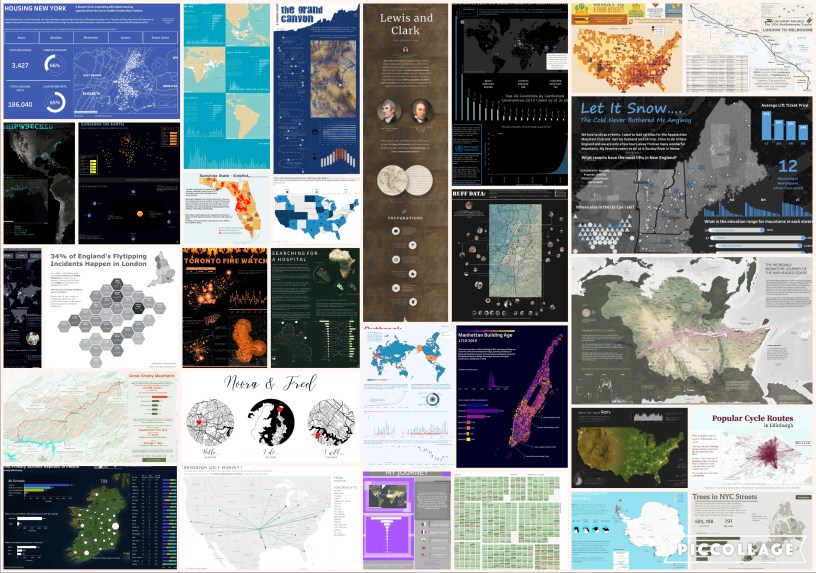
All of the entries are posted below in alphabetical order by first name (note: the placement of some vizzes have been adjusted slightly). If you tweeted your viz or thought you submitted one via the Google Form but don’t see it here, let me know and I’ll work to include any additional entries ASAP.
Please click on the links provided to view the visualizations on Tableau Public (or similar). Show your support for the participants by favouriting the vizzes you like the most.
Note: Some of the long-form vizzes have been split into separate sections to help display them on the page.

From left to right:
Amy Wu | Ruff Data
Adam Mico | Coronavirus 2019 – Isn’t Just China’s Problem Anymore
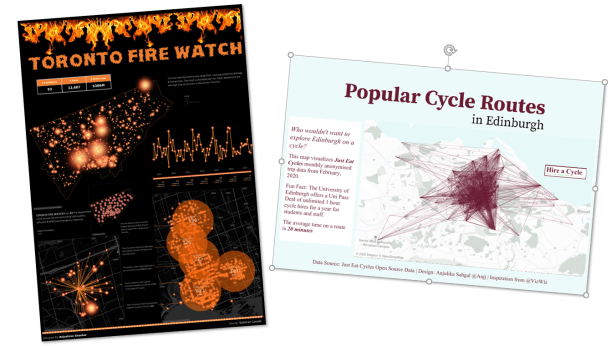
Anjushree Shankar | Toronto Fire Watch
Anjulika Sahgal | Popular Cycle Routes in Edinburgh
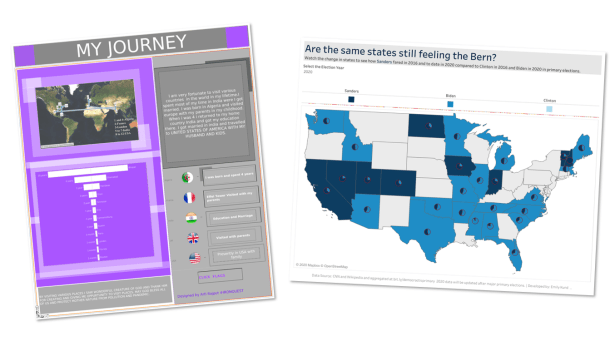
Arti Rajput | My Journey
Emily Kund | Are the same states still feeling the Bern?
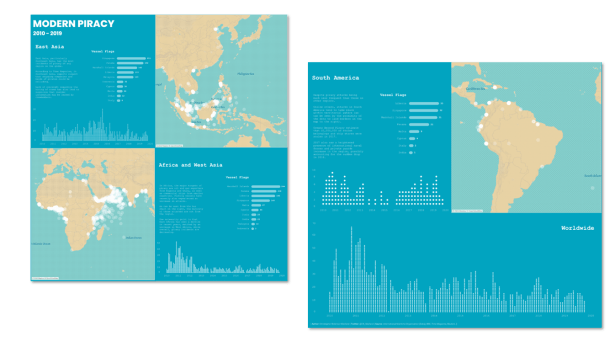
Christopher Marland | Modern Piracy 2010 – 2019
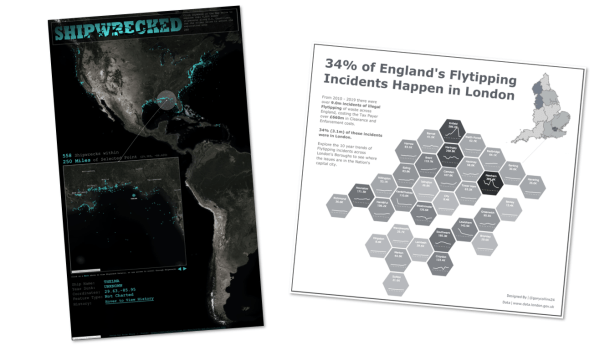
Brian Moore | Shipwrecked
Gary Collins | Flytipping in London

Gary Collins | The Grand Canyon
Fred Najjar | Noora & Fred
David Borczuk | Lewis and Clark
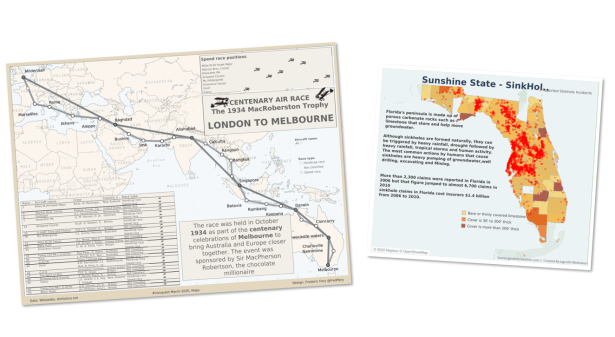
Frederic Fery | Centenary Air Race
Jagruthi Mothukuri | Sunshine State Sinkholes
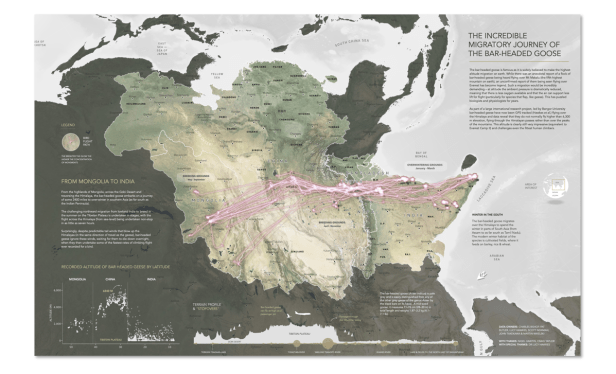
Jonni Walker | The Incredible Migratory Journey of the Bar-Headed Goose
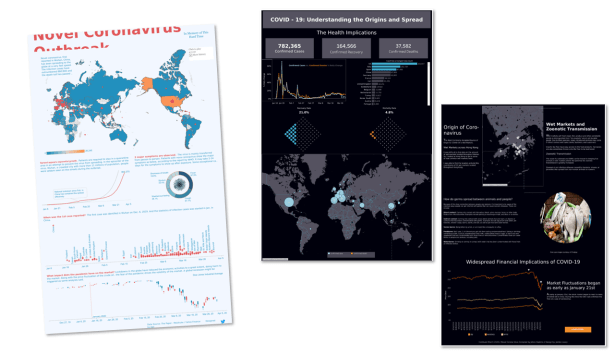
Jian Wang | Novel Coronavirus Outbreak
Jordan Lowry | COVID – 19: Understanding the Origins and Spread
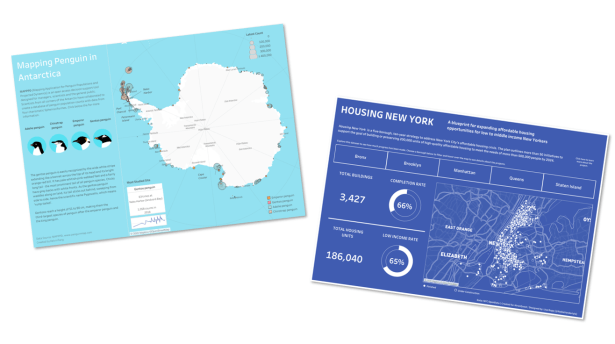
Kelvin Tang | Mapping Penguin in Antarctica
Lisa Rapp | Housing New York
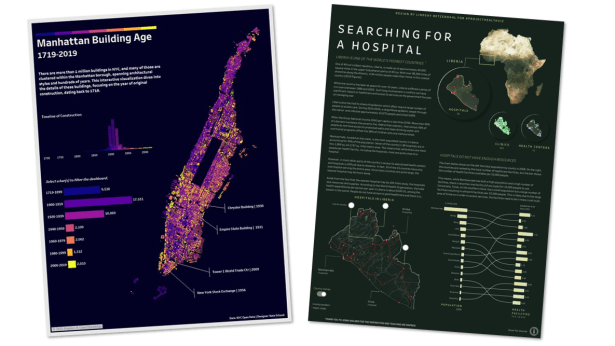
Kate Schaub – Manhattan Building Age
Lindsay Betzendahl – Searching for a Hospital

Louise Shorten | Post Primary Schools in Ireland
Mariana Silivestru | Sunshine on Earth
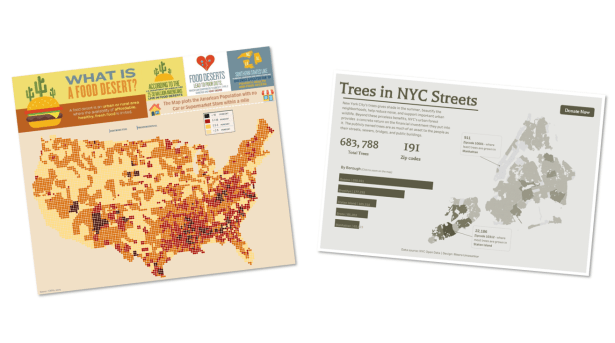
Mayank Khamesra | Food Deserts
Meera Umasankar | Trees in NYC Streets

Nathan Spence | Wanna Get Away?
Michelle Frayman | Let It Snow

Pradeep Kumar | Where Can I Expect Rain?
Riddhi Thakkar |Great Smoky Mountains
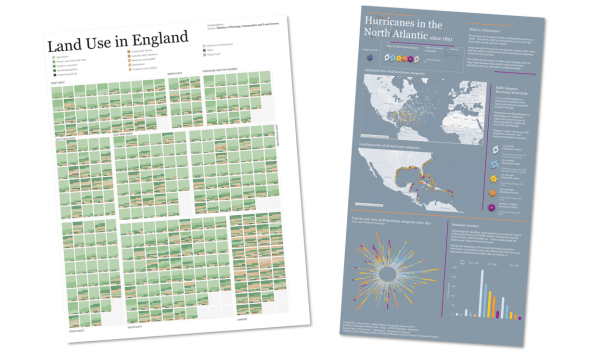
Rob Radburn | Land Use in England
Simon Rowe | Hurricanes in the North Atlantic

Soha Elghany | Rohingya Refugees
Takafumi Shukuya | Harry Potter in Translation
Both by Thi Ho:
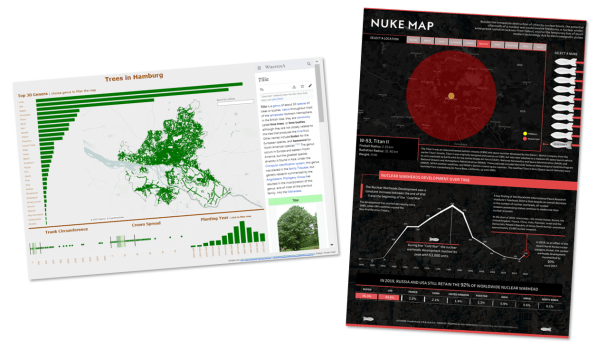
Torben Kraft | Trees in Hamburg
Vinodh Kumar & Luca Urzi | Nuke Map
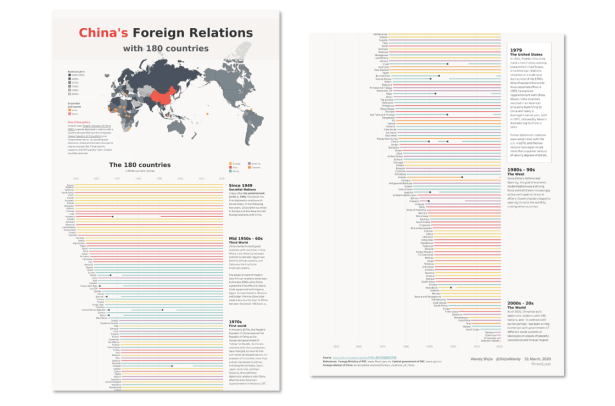
Wendy Shijia | China’s Foreign Relations with 180 Countries
The next round of Iron Quest will be announced very soon!
Follow the hashtag #IronQuest on Twitter and LinkedIn and check out the Iron Quest section on my blog for more info.
Thanks for reading.
