Exactly one year ago I published a blog post introducing a new Tableau data visualisation project; Iron Quest. I came up with the concept of Iron Quest following the 2018 Tableau Conference but I almost didn’t act on it. Filled with feelings of self-doubt, I began to wonder if we needed yet another community project.
Would people even be interested in the concept of Iron Quest?
Would I be able to run the project by myself?
What if nobody entered?
Once I had a more concrete idea of how the project would operate, I floated the concept with a number of friends in the community for their feedback. I decided at this point if nobody liked the idea, I wouldn’t take it any further. However, almost everyone I spoke to welcomed the idea and urged me to go ahead. With this vote of confidence, I formally launched the project in January 2019.
Participation Insights
To date, Iron Quest has received 142 entries from 92 unique participants. The project has been more sucessful than I ever could have envisioned!
Since January I have run 6 rounds of Iron Quest (round 6 is still open, at the time of writing) covering 6 very different subjects; crime, business dashboards, environmental issues, sea creatures, sports and food/drink.
Participants are located in a total of 22 countries across the globe with the highest rates of participation from the US, the UK, India and Singapore.

The Business Dashboards round in February has been the most popular round to date, receiving a record of 35 entries, closely followed by the #SportsVizSunday collaboration in September/October.

35% of Iron Quest participants have been using Tableau for over 3 years. However, 10% are brand-new to the tool.

58% of participants have never entered an Iron Viz feeder before.
The average age of participants is 35 years.
42% of participants are female.
My co-hosts and I have provided detailed feedback on 109 vizzes to date.
I have spoken about #IronQuest at #TFFNorthAM 2018, #LondonTUG, #UKHealthTUG, to Lloyds Banking Group internal Tableau user community and at #Data19.
How did Iron Viz participation compare in 2019?
In the past, it could be quite daunting for people entering an Iron Viz feeder for the first time. Not only were participants under pressure to build impressive visualizations but they would also need to source & prep their own data which can be challenging. When I founded #IronQuest, it was my hope that participants would become more comfortable with sourcing their own data and visualizing a specific theme through participation in this project, hopefully increasing the chances of them going on to enter the main Iron Viz competition.
A total of 294 entries were received across the 3 Iron Viz global feeder competitions in 2019. This is the highest Iron Viz participation rate recorded since the competiton began in 2011! It also represents a 31% increase in participation rates year-on-year. However in an unexpected twist this year, Tableau experimented with providing a dataset to visualise for the first Iron Viz feeder; Agriculture. The dataset in question was the United States Department of Agriculture’s (USDA) 2012 Census of Agriculture. Participants were required to use this dataset alone and could not supplement it with additional data of their own. Despite being a complex dataset which required restructuring before connecting to Tableau, people seemed to appreciate the concept. 75 people entered this feeder; a 25% increase compared to the first feeder of 2018 and 60% of participants were newcomers.
Music was the theme of the second feeder and this received a record 101 entries, of which 46% were from first-time participants! However, participants were required to source their own data for this round in the traditional fashion. For the final feeder, participants were required to visualise US migration data provided by The Associated Press. However unlike the first feeder, they could supplement this data set with their own data for this round. The migration feeder received 84 entries (compared to just 78 entries for the final feeder of 2018 – Water).
Iron Quest Viz Recap
January – Crime Data

For month one, the chosen theme was crime data. I was a little apprehensive to see how the challenge would be received by the community but I needn’t have worried. With a total of 26 submissions, I was blown away by the response to the challenge! It was great to see so many visualizations published as a direct result of this project and also to see them be so well received by the community.
February – Business Dashboards
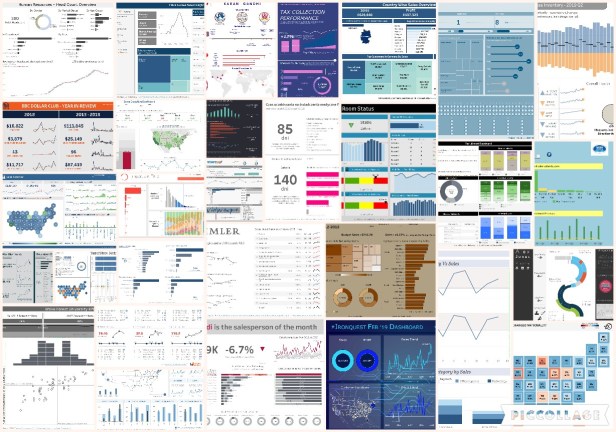
For month two, the chosen theme was business dashboards. I must admit I was initially quite surprised to see this theme win the popular vote. Thankfully, the ‘underwhelming’ business dashboard ideology didn’t put people off (phew)! In fact, 35 people entered the challenge this month, up from 26 in January. Better still, over 50% of people who took part this month had never entered an Iron Viz competition before either. As usual, the participants were creative with the theme. We saw various different takes on the classic Superstore Sales data set as well as dashboards covering fictional companies, real-life companies, quantified-self, higher education and healthcare. Topics aside we also saw a wide variety of chart types and techniques applied in the submissions; including but not limited to sparklines, hex maps, BAN’s, lollipop charts and bar charts.
March – Environmental Issues

For #IronQuest month three (March 2019) the chosen theme was environmental issues. I was hopeful that this theme would help to shine light on some important environmental topics from around the world and sure enough it didn’t disappoint. Funny enough, a few weeks after I announced the #IronQuest theme, the Iron Viz European feeder theme of ‘Energy and Sustainability’ was announced. This also coincided with a #MakeoverMonday on plastic waste on UK beaches so all in all, March was a month heavily focused on the environment!
A total of 19 people entered the challenge in March, down from a record 35 entries in February. With this challenge running alongside the Iron Viz Europe feeder and a bumper month in February, the number of entries was always going to be lower. We still saw a diverse pool of entries from enthusiasts across the world, 56% of which were female and 50% of which had never entered an Iron Viz competition before. Each entry covered a different topic including animals at risk, deforestation, air pollution, water quality and global warming. Topics aside we also saw a wide variety of chart types and techniques applied in the submissions; including but not limited to maps, area charts, radial bar charts and scatter plots. There was also a strong call-to-action on many of the vizzes which was great to see too.
May/June – Sea Creatures
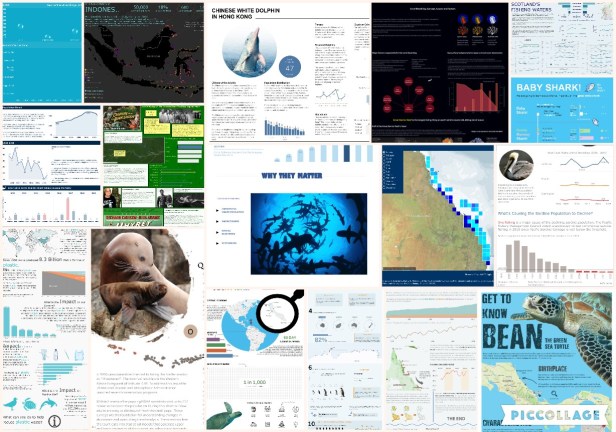
For #IronQuest month four (May to June 2019) the chosen theme was sea creatures. A total of 19 people entered the challenge this month and yet again we saw a diverse pool of entries from enthusiasts across the world, 46% of which were female and 50% of which had never entered an Iron Viz competition before. As usual, the participants were creative with the theme and we saw many different sea creatures featured. Popular creatures were sea turtles, dolphins, whales and coral. However, there were also vizzes featuring fishing, plastic pollution, qawax and even mythical creatures!
September/October – Sports / #SportsVizSunday Collaboration

For #IronQuest month five (September to October 2019) we collaborated with the #SportsVizSunday project leaders to bring you a sports-themed challenge. This was particularly exciting as it was the first collaboration of it’s kind for both projects. I have a huge amount of respect for the #SportsVizSunday leaders (Simon, James and Spencer) who have established a successful, consistent community project in a relatively short period of time and it was a privilege to collaborate with them.
We received a total of 34 entries this round! Not only that but three of the submissions were recognised by Tableau Public as ‘Viz of The Day’! This month we saw a number of #SportsVizSunday participants discover the project for the first time too. As usual, participants were creative with the theme and we witnessed a total of 13 unique sports featured across the entries received. The most popular sport was football (or soccer, depending on where you’re from), closely followed by American football and tennis. However, we also had vizzes covering less widely covered sports including ten pin bowling, badminton and even Ultimate Frisbee!
For December, we are visualising Food & Drink data. However, this round doesn’t end until 31st December 2019 so a recap of this round will be included later.
What to expect in 2020
Iron Quest will continue in a similar format in 2020. Given the success of the #SportsVizSunday collaboration in September/October, I’ll be looking to organise more collaborations in the coming year.
Based on feedback received from a Braindate at #data19, Iron Quest feedback will be focusing more on the Iron Viz scoring criteria going forward (design, storytelling and analysis) and my co-hosts and I will provide participants with tips on how they can better meet these criteria in their vizzes.
I’ll be planning some Tableau-feature (rather than topic) focused rounds in the coming year, the first of which will be mapping in 2020 Q1. These rounds will give participants the opportunity to practice specific features with the freedom of selecting a dataset of their choice. Watch this space!
Thank You!
I have been truly overwhelmed by the support received for Iron Quest this year. I never expected the project to make such an impact and to be embrased by so many people from across the globe.
Thank you to everyone who has partipated in the project to date. We wouldn’t be here without you all! Your dedication to the project has been outstanding. It’s not easy to source your own data and build a detailed viz from scratch. I truly appreciate all of the time and effort that has gone into the vizzes submitted as part of this project to date. Thank you!
Thank you to Tableau Public for supporting the project from the beginning and for featuring interviews with Iron Quest participants on the Tableau Public blog.
Thank you to Tableau and all of the User Group leaders who gave me the opportunity to speak about Iron Quest at conferences and events this year.
Finally, thank you to all of my co-hosts; Timothy Vermeiran, Ann Jackson, Kevin Flerlage, Mark Bradbourne and Simon Beaumont. I truly appreciate all of your support and appreciate you all taking the time to help grow the project.
Remember, entries are still being accepted for the Iron Quest ‘Food and Drink’ round. The deadline for submissions is 31st December 2019. If you would like to enter, you can find more information here.
You can find the full recap posts of each Iron Quest round to date on my blog here.
Thanks for reading.
