
It’s week 3 of #DearData2019, the data postcard project I’m working on with Ann Jackson this year. It’s hard to believe we’re only just writing about week 3 as we’re already tracking week 5! The mail has been particularly slow recently (potentially due to the adverse weather in the US) and we’re forever at their mercy for this project.
For week 3 we tracked every time we thanked others; whether that be in person, over the phone, in writing or virtually. I knew from the offset that it wouldn’t be practical to track this week manually. I needed an app or something to make the data collection process simple. Thankfully (no pun intended) Ann came up with the idea of using IFTTT buttons and suggested I do the same. These ended up working really well and made the whole process really easy.
I won’t go into too much detail here as Ann has written a detailed summary of the IFTTT buttons on her blog. Essentially, I created a button on my phone for each type of thank you I wanted to track. For people I say thank you to frequently (i.e. my husband or family members) and strangers (i.e. shop workers, people in the street, etc) I made separate buttons. Otherwise I made buttons for each communication medium; for instance work emails and calls, social media, etc. Then, every time I passed on a ‘thank you’ I pressed the relevant button on my phone to log it in Google Sheets. At the end of the week I combined all of the individual sheets into one and put the data into Tableau to get a sense of what it looked like.
My Postcard

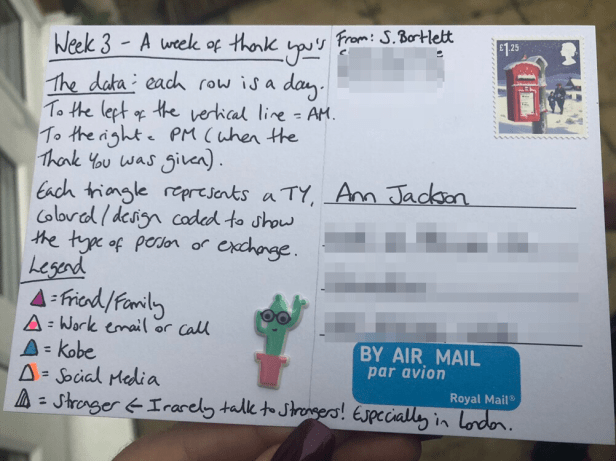
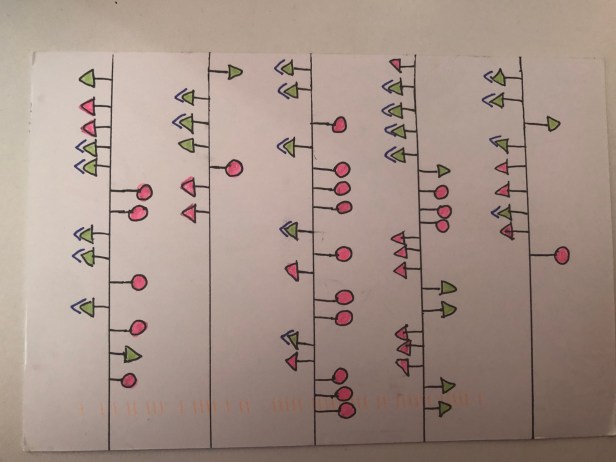
I decided to use triangles as my icons this week with each triangle representing a thank you. Rather than colouring them all differently I tried to use different types of encoding such as colouring one edge of the triangle to make the design more interesting.
I drew the icons in a liner fashion (similar to previous weeks) with each line representing a day of the week. The placement of the triangle along the line represents the time of day the thank you was given. For context, I added a vertical line to represent midday so you can tell if more thank you’s happen in the morning versus the afternoon. I think it’s fascinating to see the patterns that emerge from doing it this way.
There are some days where I went for a long time without saying thank you. This is likely because I was busy at work and had no interaction with others that required me to thank them during that time. You’ll also notice that many of the triangles are bunched together. This is because with things like social media I like to tweet in short bursts during the week when I have limited time.
Ann’s Postcard
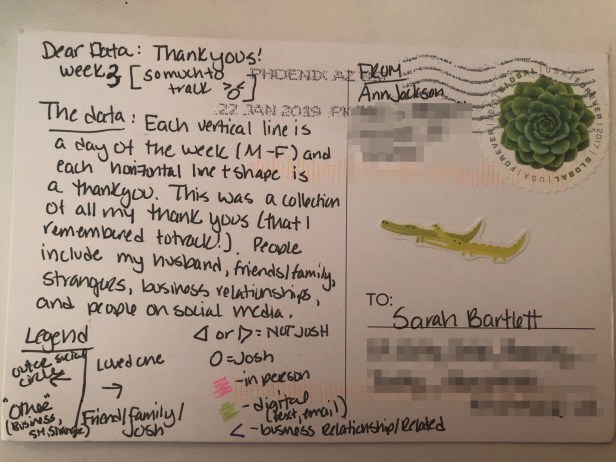
I really like how Ann separated the thank you’s to her husband or friends/family from the thank you’s to business acquaintances or other people she shares no emotional connection with. I also like how she tracked the method for each person group so not only can you see the type of person but you can also see the medium that was used to deliver the thank you.

That’s it for the week! Be sure to check out Ann’s summary post of our week here too.
Thanks for reading.
I hope you enjoyed this post.
Check back next week for our summaries of week 4.
