Throughout the year we (the Tableau Community) actively share our vizzes on social media, we participate and collaborate on projects such as #MakeoverMonday and #WorkoutWednesday and we get excited when #IronViz season starts. We find inspiration in the work published by others, we write blog posts about our design processes and we share tutorials on how to apply new techniques in Tableau. But what is central to all of these things?
Tableau Public of course.
Without Tableau Public none of these things would be possible (or they would become far, far more difficult). Without Tableau Public we wouldn’t have a platform to share our work and learn from others, we wouldn’t have the viz projects we have all grown to know and love and we wouldn’t have Iron Viz.
To conclude the Tableau Conference this year I had the opportunity to attend Fanalytics; a session facilitated by Tableau Public with the objective of connecting the thriving Tableau Public Community. Fanalytics is almost viewed as the unofficial conference wrap-up party. For many it is the last opportunity we have to connect as a community, in-person until the next Tableau Conference. In fact, for most people it is the only opportunity we have to meet so many other Tableau Public authors in person since we are a global community thus rarely get the opportunity to meet collectively.
How Fanalytics works
Fanalytics begins with inspirational talks from prominent authors in the Tableau Public community followed by table-based break-out sessions which facilitate more in-depth discussions or hands-on workshops.
This years’ discussion topics were:
- Making Tableau Public Better: share your feedback and ideas with our team of Tableau Public developers.
- Building Gender Equity: brainstorm how we can continue to recognize talented women in the community.
- Being Open to Newcomers: question what it means to be a newcomer and determine ways we all can be more inclusive.
- Reviewing Iron Viz: review changes we’ve made since last year’s competition and share ideas for how we can continue improving.
- Promoting a Data Culture in your Organization: discuss what a “data culture” looks like in the wild and how you can help spread it.
- Finding Tableau Mentors: explore what mentorship looks like in the community and how you can get involved.
Each topic has a designated leader and Tableau Public provide some conversation starters to get things flowing. Attendees are free to join any table they wish with some of the more popular topics having multiple tables. Discussions begin at each table and ideas are collected on paper. After the group discussions, each topic leader shares their key takeaways and suggestions with the room.
The Tableau Public team truly value the opinions of the community. Collectively we all want the community and Tableau Public to be the best it can be. With this in mind any ideas put forward at Fanalytics are taken seriously and it is not uncommon for changes to be implemented as a result of feedback received at this session.
Why I got involved
A few weeks in advance of conference the Tableau Public team reached out to the community in search of topic leaders for Fanalytics. I volunteered for the ‘Reviewing Iron Viz’ discussion because it’s something I am passionate about. I competed as a finalist in Iron Viz Europe in July so got to experience the competition first-hand and while I did not participate in any of the feeders for the main competition this year, I followed them closely.
The changes made to Iron Viz since 2017
Following the Fanalytics session at #data17 two surveys were built to gather ideas about Iron Viz and how the competition could be improved. The first was community-led and the second was organised by Jenny Richards from Tableau (with community involvement). I won’t go into too much detail about these in this post but you can view the results of the community survey here and the Tableau survey here.
After receiving the survey feedback the Tableau Public team implemented the following changes to the 2018 feeder competitions:
- Announcing entire 2018 feeder schedule upfront & extending the submission window to one month
- Highlighting the most favourited submission on the blog (Crowd Favourite). ‘Votes’ for Crowd Favourite are cast using the favourite feature on Tableau Public.
- Introducing special mentions, i.e. Best New Entrant
- Collecting feeder competition theme ideas from the community (#IronVizTheme)
- Allowing participants to receive their score & judging feedback (optional)
- Scoring on the basis of Design, Storytelling, and Analysis (removing “Overall” category)
- Including guest judges from outside of Tableau (note only the top 10-highest scoring submissions in each round were reviewed by the guest judges):
-
- IV Europe: Moritz Stefaner & Stefanie Posavec;
-
- IV Books & Literature: Alberto Cairo & Cole Knaflic;
-
- IV Health & Well-being: Max Roser, Mona Chalabi & Nadieh Bremer;
-
- IV Water: Giorgia Lupi, John Burn-Murdoch, RJ Andrew & Shirley Wu
Changes were also made to the Iron Viz Finals from the European competition onwards. Namely, finalists had to use Tableau Prep and had the opportunity to include supplementary data sets to help tell their stories. Their Tableau Prep flows were briefly shown on stage during the live shows but were not taken into account for the judging. Also, finalists this year received their data set three weeks prior to competition (previously this was provided a few days before the live shows).
Thank you Tableau Public!
Before I continue I want to stress that on the whole the changes that were implemented to the competition in 2018 were pleasantly received by the community. The Tableau Public team (in particular Scott Teal) have worked tirelessly all year to ensure that Iron Viz runs smoothly and the judging process is an impartial as possible. There were 198 entries through the 3 x feeders this year (excluding the European competition) so the judging process alone has been no easy task. Thank you Scott and the entire Tableau Public team for everything you do. We really do appreciate it!
Reviewing Iron Viz
I was fortunate to be joined by a fantastic group of passionate people for the table discussion; a group which included 2018 Iron Viz finalist Corey Jones, former Iron Viz finalists Jacob Olsufka and Russell Spangler, long-time Iron Viz participant & former Crowd Favourite winner Luke Stanke, Susan Glass, Gina Bremer, Simon Beaumont, Scott Teal from Tableau and a few others. Almost all of those at the table at participated in an Iron Viz feeder previously, if not as a finalist on stage so were more than familiar with the competition and any potential areas for improvement.
Our discussion centred around five key themes;
- Feedback
- Incentives & Recognition
- Crowd Favourite
- Effort
- Overall Goal
1. Feedback
We collectively agreed that the judges feedback option implemented this year had been well received. The feedback has often given contestants invaluable advice or highlighted areas for improvement which they can act upon accordingly. However, contained within this feedback were scores marked against the judging areas; Design, Storytelling, and Analysis. In isolation, these scores mean very little. For instance, how would a contestant know if a score of 6 for analysis was good or at least above average without some visibility of the other scores awarded? Also, a contestant currently has no way of knowing if they placed 11th or 50th overall given that only the top 10 positions are shared.
In our discussions we agreed there would be value in contestants knowing this information and by sharing it, it could help encourage contestants to challenge themselves and enter further feeders with the intention of improving their scores or placement position. One solution we discussed was an anonymous dashboard, similar to this example taken from the ‘Big Book of Dashboards’:
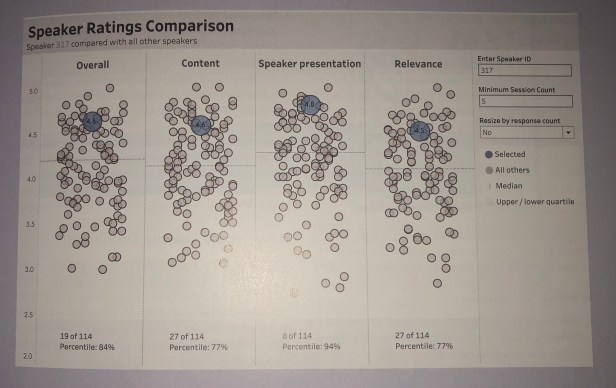
In this example conference speakers are shown their feedback ratings by category versus the other speakers at the conference. This enables them to gauge where they placed overall. While the other speaker scores are shown, their identities remain anonymous.
2. Incentives & Recognition
While Iron Viz is a popular competition, only a small fraction of Tableau users enter the feeders. There could be multiple explanations for this (which I won’t get into now). However, as a group we agreed there could be more to incentivize people to enter, aside from the prospect of making into the live finals and everything that comes with that.
Russell suggested the idea of Iron Viz participants earning virtual badges to display on their Tableau Public profiles. The badges would be a way to empower and enthuse the community even more but also to help people search for profiles of interest based on badges awarded. As long as the badges were limited in number and structured well enough, Tableau Public could automatically award the badges when authors achieve the required milestone and then it would show up on their Tableau Public profile page. Similarly, if authors achieve certain milestones they could also receive badges to recognise their achievements; for example Viz of the Day winner, Viz of the Week winner, publishing 100 vizzes, achieving 500 followers etc.
Simon is so keen on this idea he has posted it as an idea on the forums which you can upvote here. Other incentives suggested were physical badges/buttons, Tableau swag and virtual Twitter profile stickers.
Another thing we discussed were people’s reasons for entering the competition in the first place. Given that there is essentially only one winner in each feeder, the chances of actually winning are pretty narrow. Despite this many people enter year after year for the experience itself, to push themselves & improve their skills. It is not only about winning. In fact, some contestants don’t actually want to win & be faced with vizzing live on stage in front of thousands. Susan Glass came up with the perfect analogy for this, stating that just because somebody enters a marathon it doesn’t mean they want to win it. Instead they enter for the challenge & the experience of taking part. With this in mind we discussed the possibility of allowing people to enter the feeders but opting out of being selected for the finals. This would enable them to experience the competition & everything it has to offer without having to face the prospect of getting through to the finals which, lets face it, is very different to the feeder stages!
3. Crowd Favourite
The Crowd Favourite Award was re-introduced to the competition this year following the feedback received via the surveys. However, as a table we discussed our concerns around this award. In short, it’s not entirely clear what the point of the Crowd Favourite Award is. It doesn’t give the constants any bonus points, nor will it further them in the competition in any way. In many respects this award feels somewhat like a popularity contest. Some of us spoke from experience to describe where we had seen a popular member of the community or workforce enter Iron Viz and their submission receive a large number of votes from their office peers or friends within the community; purely because of who they are and not based upon the quality of the viz. This kind of activity discredits the award even further and does more harm than good. Also, what is there to stop people from setting up Tableau Public accounts purely with the intention of voting for Crowd Favourite? Should this be allowed? While we could appreciate why it was re-introduced, we agreed as a table that it is just another form of recognition that we wouldn’t particularly miss it if it was taken away.
4. Effort
This year the feeder window was extended to one month. This is great in some respects as it gives contestants more time to build a visualisation whilst working around a busy schedule. However, the added time could also give some highly skilled contestants (with spare time on their hands) more time to build something more elaborate, thus potentially creating a greater divide between the average entry and the more complex entries. While we agreed at the table that we enjoy seeing the more elaborate vizzes in the Iron Viz feeders, at the same time we don’t want these vizzes to discourage people from entering. Shortening the completion window would help address this but also goes against the original notion of giving people more time to participate.
5. Overall Goal
Finally we discussed what is the goal of Iron Viz? Is it to showcase Tableau functionality and or is it something else? We agreed that the goal of the feeder stages and the goal of the final differ greatly. While the feeders encourage contestants to push boundaries and submit outstanding vizzes there is rarely time for this in the final. As a result the final is often more centred around showcasing product features and best practices.
Should the goals be more clearly defined?
The best of the rest
Other ideas we discussed included:
- Providing written feedback to Iron Viz finalists
- Is Top 10 enough? Currently only the top 10 highest-scoring vizzes are reviewed by the external judges. However, would this work better if it was based on a percentage rather than a fixed number, especially if more people were to enter the competition in future feeders?
- Tableau could work with User Groups to facilitate smaller Iron Viz competitions. This could help widen the reach of the competition and potentially encourage more people to enter the feeders.
Thank you to everyone that joined the discussion. It was fun experience and I hope we see some positive changes as a result.
Thanks for reading.
*Photo credit Zach Bowders
