The annual Tableau Conference is one of the highlights of my year. If you have never attended you may find it strange to hear that I rate a software conference so highly. However, Tableau Conference is much more than a conference to me. It’s a family reunion. It’s an opportunity to reconnect with old friends and make new friends too. It’s an opportunity to meet people in person that I have only ever connected with virtually. It’s also a time to get inspired and refuel myself with ideas that will see me through the next 12 months.
This year’s Tableau Conference was held at the Ernest N. Morial Convention Centre in New Orleans and was attended by 17,000 Tableau fans; the largest Tableau Conference to date. To host a conference of this magnitude under one roof you need a large venue and the Convention Centre was huge! In fact, it was 1km long and spanned 3,000,000 square feet. Walking from one end to the other through crowds of people was no joke! It’s hardly surprising that my step count for the week was through the roof.
Attending Tableau Conference 2018 was a very memorable experience and I have returned home full of inspiration. This inspiration is not only from the sessions I attended but also from the people I met during my time in New Orleans. Before it becomes a distant memory, here are my highlights.
Pre-Conference
Exploring New Orleans
Before conference began I had the opportunity to explore New Orleans and experience some of what the city has to offer. I admired the buildings in the French Quarter, sampled Beignets in Café du Monde, explored Jackson Square and the St Louis Cathedral, got caught up in a mid-year St Patrick’s Day parade (any excuse for a party right), posed for photos outside the aptly named ‘Tableau’ restaurant, went kayaking in the Bayou and visited the World War II museum (which was incredible to say the least). All this before stepping foot in the convention centre!


Data Plus Women Pre-Game Event
On Sunday evening I had the pleasure of attending the Data Plus Women pre-game drinks reception. Organised by Emily Chen, this event has been a conference highlight for me for the last three years. Why? Because it is the perfect opportunity to meet people from the community in a relaxed environment before the conference craziness begins. I remember attending my first conference in Austin in 2016 and being apprehensive about attending this event because I didn’t know many people. Needless to say, many others were in the same boat. In fact this was the event where Pooja first met Adam after being introduced by none other than Jonni Walker! At this years event I was slightly overwhelmed by the people I did know (or at least recognised from Twitter). I spent most of the evening working my way around the room in an effort to say hello to everybody while I had the opportunity. It’s been great to see this event go from strength to strength and I hope it is on the agenda again next year.
Monday
Workout Wednesday Braindate
Braindates were a fantastic new addition to the conference this year. Through the Braindates app, conference attendees could set-up a Braindate to share their knowledge or advice on a subject of their choice. Other attendees could then opt-in to attend Braindates of interest to them. Braindates could be either 1-2-1 or group sessions and were held in a dedicated, relaxed space which featured comfy seating and inflatable meeting igloos (yes, you heard me right)! Prior to conference I had opted to join a Braindate with Luke Stanke, Ann Jackson, Kim Unger and Lindsay Betzendahl to discuss “How can we make #WorkoutWednesday better for 2019?”. Luke & Ann are co-leaders of the #WorkoutWednesday project (along with Rody Zakovich and Curtis Harris) and were keen to hear feedback from other participants.
We had a great discussion and gave them some ideas to take away. Thanks to the informal nature of Braindates we were also joined by Neil Richards for most of the session as he happened to see us whilst walking by. Unfortunately, due to my busy schedule I was unable to schedule any other Braindates at conference. However, others like Jake Pearson from UBS dedicated a significant amount of time to Braindates by completing close to 25 meetings! I hope to see Braindates back on the conference agenda next year.


#MakeoverMonday Live
A Tableau Conference must-attend is the #MakeoverMonday LIVE session. As a regular participant in the project it’s always fun to complete the project under pressure surrounded by other #MakeoverMonday fans. This year was particularly special as it coincided with the official launch of ‘#MakeoverMonday The Book’. Andy and Eva have done a phenomenal job of making the project what it is today. 700 people attended this session and so many people tried connecting to the Data.World site to download the dataset that both the website and Wi-Fi crashed! Thankfully I was able to get online before the issues occurred. This year I had the pleasure of collaborating with fellow #IronViz Europe Finalist Klaus Schulte on a viz. It seemed only fitting that we work together after our #TC18Europe experience. Klaus really knows his stuff and we had fun building a viz together in an hour. Thank you Klaus!


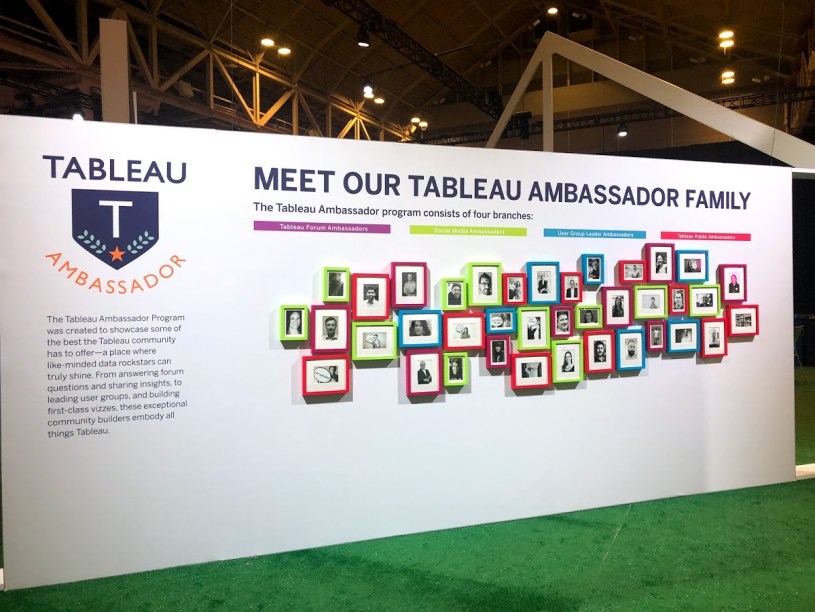
The Parade at the Welcome Reception
I was privileged to be named as a Tableau Social Ambassador earlier this year so this was my first conference where I experienced the Ambassador treatment. This year, Tableau gave us the amazing opportunity to participate in a surprise New Orleans-style parade. There were floats, beads, masks, a marching band, dancers, parasols and more. It was truly an unforgettable experience! The Zen Masters and Ambassadors were split across separate floats but since the floats could only hold 10 people, other Zens and Ambassadors opted to walk the parade also. I was joined on the Ambassador float with Christopher Scott, Gregory Lewandowski, Brittney Fong, Chantilly Jaggernauth amongst others and together we frantically threw beads out to the crowds as we were led around the Data Village. Sorry to any unsuspecting members of the crowd who I managed to hit in the face with beads along the way. It’s actually much harder to throw beads than it looks!


The Vizzie Awards
The Vizzie Award ceremony, led by the Tableau Wannabe Podcast hosts Matt Francis and Emily Kund was held during the Welcome Reception this year. As a result, there were many more people in attendance than in previous years and the atmosphere was still buzzing after the parade. The Vizzies are open to non-Zens only and winners are nominated by the community. This year saw the addition of a particularly special new award for Community Leader. After the sudden passing of long-time Tableau Community member, supporter and friend to many Michael W.Cristiani earlier this year, Emily and Matt decided to rename the Community Leader award in his honour. I had the pleasure of meeting Michael at #data17 and have heard many stories of how great he was in supporting and encouraging others in the community. It seemed only fitting that they named the award after him.
Whilst standing in the Community area enjoying the ceremony I was surprised to hear my named called when I was announced as the winner of the ‘Must Run on Coffee or Coke’ award! This award goes to the person that never stops (literally) and must drink lots of coffee to stay awake. I happily accepted the award and sat back down to enjoy the remainder of the ceremony. Not long after my name was called again but this time I was being called to the front to accept the Michael W.Cristiani Community Leader Award! I couldn’t believe what was happening! I never expected to be nominated, let alone win such a highly regarded award. With my hands shaking in shock I accepted the award from Michael’s good friend and long-time community member Dan Murray. I remained in complete shock for the next few hours and still can’t quite believe it. Thank you so much to everybody that nominated me. It is such an honour to be recognised as a leader within the community and to accept an award named after Michael is particularly special.


Tuesday
The Opening Keynote
The first keynote at Tableau Conference is always exciting and this year was no exception. Before the keynote began I had the opportunity to catch up with some famous community faces and Tableau staff including Francois Ajenstat and Elissa Fink. Sitting in the front row we got excited about what Tableau has achieved so far and got a sneak peek into what is coming in the future.


Paul Banoub – “Tips for building a scalable enterprise deployment of Tableau”
Next up was Paul Banoub’s session. Paul is an expert in his field and never fails to deliver an insightful talk, filled with useful tips. This session was no exception. I recommend watching the session recording here.
Meeting the Slalom Team
I had the honour of representing Slalom at Tableau Conference this year. While I am based at the London Slalom office, we are an American company and London is currently the only Slalom office located outside of North America. As a result, the majority of my colleagues are based across the pond in North America and 104 of these attended conference this year! The conference gave me the opportunity to meet lots of Slalom colleagues in person for the first time; it was great to put names to faces at last!
On Tuesday I helped out at the Slalom booth in the Expo Hall where I was joined by #DataPlusWomen advocate and fellow ‘Slalomite’, Katie Poznanski-Ring and Tableau & Alteryx superstar Caleb Catalano. This was my first time working on a booth at Tableau Conference and it was great to get involved and meet some of our clients. I also bumped into various other Slalom colleagues during the week including Wale Ilori, Nelson Davis, Nick Hayden and Gina Bremer, as well as my colleagues from the London office, Siraj and Maddy.


The A-Z of the Tableau Community
This year I had the honour of speaking at conference for the first time with my good friend, Lorna Eden. Lorna and I have spent months putting together a talk aimed at getting people more familiar and engaged with the Tableau Community. We believe there is a lot the community has to offer that people don’t know about so we decided to put together a conference talk to inspire people to get more involved. Lorna and I were delighted to deliver our talk to a full room, especially since our session clashed with many other talks led by big names in the Tableau Community. Watch the recording of our session here.
Wednesday
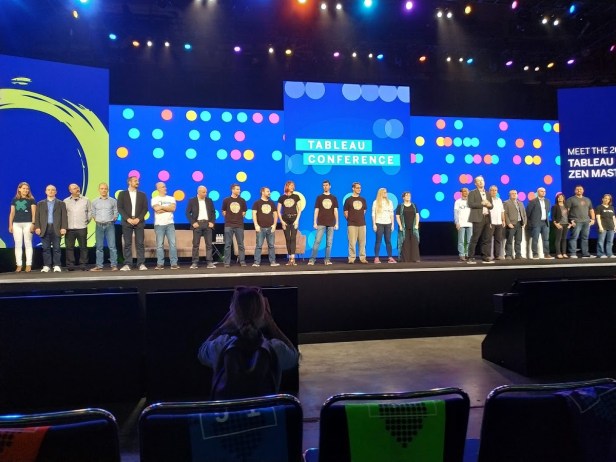
Dev’s on Stage
Wednesday kicked off with Dev’s on Stage; a fantastic session where Tableau Developers give an overview of exciting new features that are coming to the product in the near future. However, before Dev’s on Stage we were treated to Zen’s on Stage. This is where all of the Zen Masters are formally introduced by Andrew Beers in front of the 17,000 strong audience. The Zen Masters are such a talented and inspiring group of people it was great to see them recognised in this way.
Next up the talented Dev’s showcase the features we can expect in Tableau soon. Dashboard features like transparent zones, toggle zone visibility and export to PowerPoint got big cheers this year. Other notable new features announced were automatic phone layouts, set actions and support for web hooks (which made Paul Banoub very happy!).
Mike Cisneros – “You are an artist | How and why to get started making public data visualizations”
Next up was Mike’s session which focused on why we should start making public data visualisations. Upon entering the room for Mike’s talk I was greeted by so many familiar faces from the community, many of whom I had never met before in person. It was a truly special experience which I would liken to a family reunion. Mike clearly has many fans in the Tableau Community.
I had the pleasure of hosting Mike at the EMEA Tableau Fringe Festival earlier this year and was blown away by Mike’s virtual talk at his event. Mike is an exceptional speaker and has a very persuasive speaker style. I can confidently say this is one of the best Tableau Conference talks I have ever attended. I highly recommend you watch it back if you missed it here.
Paul Chapman – “How Tableau delivers $35m of quantified benefit to JLL. And that is just the beginning”
Next up was Paul Chapman’s highly anticipated session. Paul has been talking about his session for months so I knew it was going to be special….with a few surprises thrown in too. In tribute to Paul, Lorna made a number of novelty bow ties for the crowd to wear for this session which was a lot of fun.
Paul spoke about all the great work that his team are doing at JLL and showcased many example dashboards which provided me with plenty of inspiration to take back to work. Paul also kept the talk exciting with quizzes and even a t-shirt cannon! You can watch the session recording here if you missed it.
User Group Tips Battle
I was honoured to be invited to be part of the organising committee for the Tableau User Group run at conference this year. Last year this event was run by Paul Chapman and Christopher Scott and they delivered a fun, high energy session which we knew would be difficult to match. In the lead up to conference I had a few planning calls with fellow organisers Jeffrey Shaffer, Anya A’Hearn, Patrick McCormick and Jordan Scott to agree what we were going to do this year. Anya and Jeffrey came up with the idea of running a Halloween-themed session that we decided to go with since it seemed fitting due to the time of year and New Orleans. They also agreed to host the session….in costume (of course) with Patrick, Sarah Battersby (mapping genius), myself and a member of the crowd acting as judges. We invited 8 people from the community to join us to battle. In selecting the contestants we tried to pick a range of people; some who have been using Tableau for a long time and others which are relatively new to the product. There were 3 rounds; 1 minute of Tableau tips followed by tips using older versions of Tableau and for the final a 10-minute speed-vizzing challenge using Jeffrey’s famous ‘Trick or Treating’ data set. The contestants were split across 4 groups and only one winner from each group could proceed to the next stage.
The session proved to be a lot of fun. Anya and Jeffrey looked amazing in their skeleton costumes. Some of the contestants dressed up too; Kev Flerlage dressed up as Willy Wonka and even entertained the audience with some songs while Mark Bradbourne also had a great costume complete with hair! Continuing with the New Orleans-Halloween theme we gave out Halloween candy and beads during the session. Also, we were able to borrow Paul Chapman’s t-shirt cannon from his prior session and Anya had great fun firing t-shirts into the audience. That’s got to be a Tableau Conference first!
All of the contestants presented some impressive Tableau tips making the selection process particularly difficult for us judges. I don’t think I’ve ever seen anyone present tips as fast as Ann Jackson and Luke Stanke while Kev tried to bribe the judges with creative titles on his dashboards (nice try, Kev)! The final saw Kev (who has only been using Tableau since February 2018) go head to head with Luke (a Tableau heavyweight) to build a dashboard live in just 10 minutes. Kev built an impressive pumpkin in PowerPoint and used a chart in Tableau for the mouth while Luke found an interesting story in the dataset and even embedded a video in Tableau. Needless to say, Luke clinched the title and was crowded champion! All in all this was a really entertaining session. Thanks to all of the contestants and to Jeffrey, Anya, Jordan and Patrick for your help in organising it.


Iron Viz
One of my conference highlights is always Iron Viz and this year was no exception. After competing in Iron Viz Europe in July I have a new-found appreciation for the contestants and everything they were going through, both on stage and in the lead up to the competition. I had a chance to meet all three contestants prior to Iron Viz; Corey and I met at Tableau Conference last year, Timothy and I met at a Tableau event in London a few months ago and Ludovic and I met in New Orleans. I was on the edge of my seat for the entire 20 minutes and anxiously watched as they raced against the clock to build their best vizzes. All three contestants did a fantastic job in visualising the weather data set they had been provided by IBM and they all delivered an impressive presentation of their work afterwards. However, there can only be one winner and Timothy was crowned champion for his 2-part dashboard which utilised the pages shelf to incorporate animation; similar to what helped Tristan clinch the title last year.
After Iron Viz I had the pleasure of meeting Giorgia Lupi, (co-author of ‘Dear Data’ and ‘Observe, Collect, Draw’) who had arrived ready for her talk the following day. It was a pleasure to meet Giorgia in person after following her work for a long time and we had a great conversation. I then ended up walking back to my hotel with all three Iron Viz contestants (complete with Timothy’s trophy) which was a surreal experience to say the least as people were running up to them on the street to say hello and pose for selfies.


Data Night Out
Wednesday concluded with a fabulous party held at the Mercedes-Benz Superdome which was headlined by Trombone Shorty. It really was an impressive! Afterwards we visited Frenchmen Street to experience some live music. All in all a fun evening!


Thursday
Ann Jackson & Lorna Eden’s Speed Tipping Session
For the past two years, Andy Kriebel and Jeffrey Shaffer have run speed tipping sessions at Tableau Conference that were judged by Lorna and I. This year the tables were turned when Ann and Lorna decided to take on the challenge and attempt to present 100 tips in just 50 minutes (I believe the record set by Andy and Jeff last year stood at around 89 tips)! Ann and Lorna are no strangers to speed tipping. Ann won the speed tipping challenge in Vegas last year while Lorna remains reigning champion of the London TUG Tips Battle.
Ann and Lorna put on quite the show and delivered well-over 100 tips in their session, breaking the previous record. I am so proud of both of them as they truly rocked on stage! This is definitely a session to replay again and again in order to be able to take in all of the content. Watch the recording here.


Fi Gordon – Achievement Unlocked – From Rookies to Rock Stars – building capability through gamification
Next up was Fi Gordon’s highly anticipated session where she presented her gamification training programme she put together whilst working at Comsec. I saw Fi give a shorter presentation at TFF APAC earlier this year and was really impressed with how she had used gamification to make learning Tableau fun and incentivizing for her team. Fi is an advocate for data literacy and is kindly sharing her gamification training system for free to anyone that wants to adopt it in their workplace. In her session she spoke through how it works and the benefits she saw from it. I personally can see so many use cases. I highly recommend watching Fi’s session here if you missed it live.
Fanalytics
The conference agenda concluded with Fanalytics; a session run by Tableau Public where authors get together to share their stories, inspire others and discuss how we can make the Tableau Community and Tableau Public better. I missed Fanalytics last year and regretted it so I made sure to attend this year. The session was hugely popular with a packed room (great to see since there’s always a risk that people will leave conference early and be forced to miss it). Unfortunately I missed the first two presentations by Vince Baumel and Andy Kriebel since I was desperate to get a photo in the green-screen photo booth before the end of conference (the 60 minute wait was worth it though). However I have heard great things about both talks so hopefully they’ll do a recap at another event soon. I arrived just in time to see Lindsey Betzendahl give a great talk about her Tableau journey so far. I am a big fan of Lindsey’s work and her #ProjectHealthViz project is really inspiring. Next up Chantilly Jaggernauth and Amar gave an impressive talk about the ‘Millennials in Data’ scheme they helped to set up which aims to bridge the data literacy and analytical skills gap by training, mentoring and preparing millennials to enter a data-driven global environment.
The second part of Fanalytics saw us gather in groups for both focused workshops and table discussions on a variety of topics including mentoring, improving Tableau Public, being more welcoming as a community and diversity. I had volunteered in advance to lead a table discussion to review the format of Iron Viz. We attracted a full table of people including some previous Iron Viz contestants and had a great discussion before I presented our findings back to the room. I’ll documented everything we discussed in a separate blog here.
Inspiration….Everywhere
Compared to previous years I felt this conference was even more inspiring. I’m proud to say that more than ever before the Community came across as welcoming, inclusive and open. That’s not to say that it wasn’t before but this year it felt that newcomers were being truly embraced and celebrated. In many sessions I attended there was a huge focus placed on up-skilling, showcasing your work in public and embracing feedback. I am an advocate for all of these things so that was great to see and hopefully we see more people participating in the community as a result.
What made conference really special this year were all the great people I got to meet. I lost count of the number of people I bumped into between sessions and at various different events. Some of these people were those I had been chatting to all year on Twitter while others were familiar with my work and just wanted to say hello. I had some great conversations in the corridors and hope these conversations continue post-conference.
I can’t possibly thank everyone I met. If I did I would surely forget somebody and that would be unfair. However, I would like to give a special shout-out to a few people who brightened up my conference. Don’t be offended if you aren’t mentioned. I would never finish this post if I mentioned everyone! Everyone else – you know who you are. #Datafam
Kev Flerlage – You were top of my list of people I was looking forward to meeting at conference and you did not disappoint. What you have achieved in such a short period of time is nothing less than extraordinary! Thanks for all of your support and for being such a good sport during the TUG tips battle!
Susan Glass – It was an absolute pleasure to meet you finally. Meeting you at the same time as Sue Grist couldn’t have been any better timed! Thanks for joining my table discussion at Fanalytics too and I hope you enjoy the book.
Sue Grist– It was an absolute pleasure to meet you at long last! Your energy and drive are truly inspiring and meeting you during Mike’s session is a moment I won’t forget. Keep up the great work.
Mark Kernke – It was great to spend more time with you at conference and enjoy some great discussions. You are officially no longer a conference newbie! Keep up the great work and thanks for all of your support.
Klaus Schulte – It was great to spend more time with you at conference after the whirlwind that was #TC18Europe! Thanks for being my #MakeoverMonday buddy!
The Iron Viz contestants; Corey, Ludovic and Timothy – I had fun hanging out with you all and I’m glad you were all able to enjoy conference despite the pressures of the competition. You all did incredibly well on stage and should be proud of yourselves.
Cesar – Your ghost stories were one of the highlights of my conference!
Michelle Gaudette – It was an absolute pleasure to meet you. Your enthusiasm and drive is really inspiring and seeing your become more and more blown away by the sheer scale of conference as the days past was really quite something! I hope to see much more of you in the community in the coming year.
Luke Stanke – It was great to meet you at long last. Keep being super opinionated!
The London TUG Team – Paul Chapman, Paul Banoub & David Pires – You guys are awesome but you know that already!
Lorna Eden – I wish you hadn’t injured your shoulder on day one. Nevertheless, I’m proud of you for battling through and rocking it on stage with Ann!
Fi Gordon – Why do you live so far away?! I wish we could spend more time together, rather than just once a year. Thank you for buying me my first ever Tableau mug too!
Sarah Burnett – It was a pleasure to meet you at long last! I hope you enjoyed conference as much as I did. Keep in touch!
Christopher Scott – Thanks for being my float buddy! I couldn’t have asked for anyone better!
Laura Sandford – It was a pleasure to hang out with you more this year. I hope you enjoyed conference as much as I did!
Curtis Harris – It was great to spend more time with you this year. Congratulations for making me cry with your blog post on the way home!


I also want to extend my thanks to the Tableau team; in particular Amanda Boyle, Jordan Scott, Marissa Michelotti, Jenny Richards, Jonni Walker, Taha Ebrahimi and the rest of the events team for putting together such a great event. I’m so grateful for everything you do for us.
See you in Las Vegas for #data19!
Thanks for reading.

oh wow, I love this blog post.
LikeLike
Thanks Hesham! I’ve just read it back and it’s got me excited for #data19! So pleased you have the opportunity to attend now also! Look out for my conference tips blog post coming soon.
LikeLike