As much as I love Tableau I’m not a fan of the standard tooltips. These are the bog-standard tooltips which Tableau automatically builds for you that look something like this:

Whilst the design is clean and simple they are uninspiring and can easily become messy if left unedited. I highly recommend checking and cleaning up your tooltips before publishing a viz. It’s finishing-touches like these that can make such a difference to the overall viz design and user experience. It doesn’t take much effort either so there’s really no excuse.
A while ago Adam Crahen (the ‘less-fun’ half of The Data Duo) wrote a 3-part series on tooltips and steps you can take to improve them. I highly recommend checking this out as it contains so many tricks you can use in your own work to improve your tooltips. Adam is well-known for his slick tooltips so it’s worth checking out his work on Tableau Public too.
In this post I want to focus on something I struggled with recently. While I like to make sure my tooltips are ‘cleaned-up’ before publishing a viz I hadn’t really experimented with adding colour to tooltips before. I had seen others use colours in their tooltips which dynamically changed to match the colour of their selected marks. For instance, if the mark for ‘Office Supplies’ was shown in orange in the viz, the words ‘Office Supplies’ would appear in the same colour in the tooltip, like this:
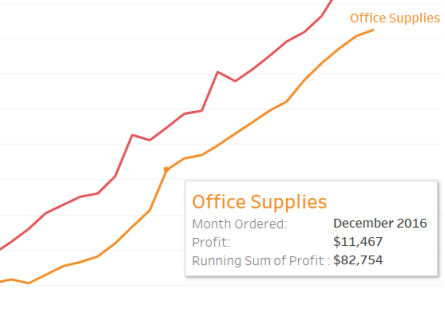
It’s actually a really simple technique which I think looks great. It’s a bit more fiddly the more colours you want to use but it’s ideal if you only have a few.
Here’s how you do it:
Step 1
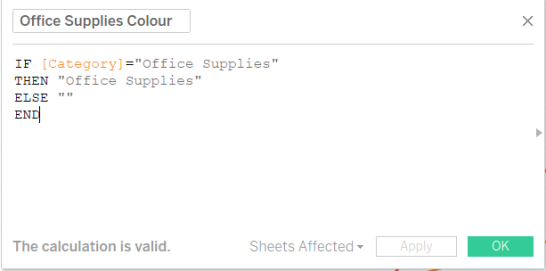
Create a new calculated field for each category or item that needs a colour of it’s own. Copy and repeat for each one. The calculation should look like this:
Step 2
Move each of the new calculated fields created in step 1 to the detail shelf in the view (I’m assuming you have already built a chart at this stage which uses the category identified in step 1 on the colour shelf to differentiate the categories in the viz).
Step 3
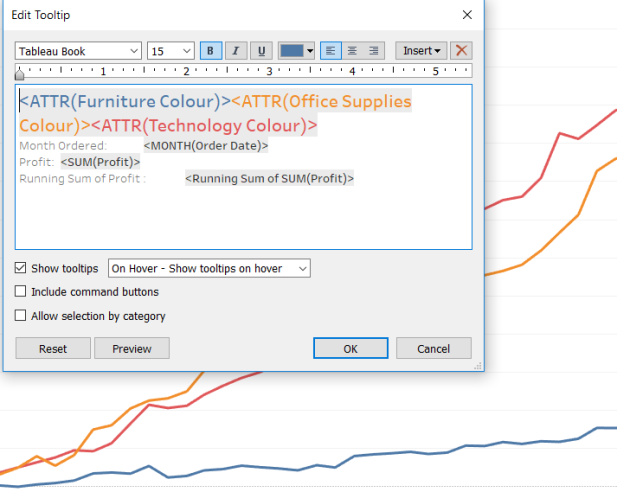
Update your tooltip to include all of the new calculated fields from step 1. Place these one after another in the tooltip with no spaces in-between. Manually colour the text of each one to match the colours you are using in your viz. Your tooltip should look something like this:
Step 4
The only thing left to do is to make sure everything is working ok!
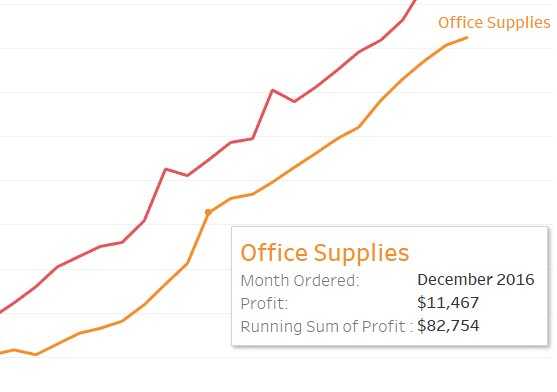
Your tooltip should look something like this:
I hope you found this useful.
Thanks for reading.
Nice tip, thanks Sarah! 🙂
LikeLiked by 1 person
Thanks for the tip, Sarah! Super easy!
LikeLiked by 1 person
Thank you Kris!
LikeLike
How about creating a sheet with categories dropped on Label and categories re-dropped on the colors. Then use that sheet in another sheet as tooltip which filters by category.
Will be more efficient to manage from one place. and will be consistent with colors as well.
LikeLiked by 1 person
Yes you could do that too. I published this prior to the introduction of viz in tooltips so that solution wasn’t an option back then.
LikeLike
Awesome, thank you very much!!
LikeLiked by 1 person
Many Many Thanks, it worked so easily and smoothly
LikeLike
Hi Sarah! Thanks for this tip! Also, I think the links for the Data Duo references need updated.
LikeLike