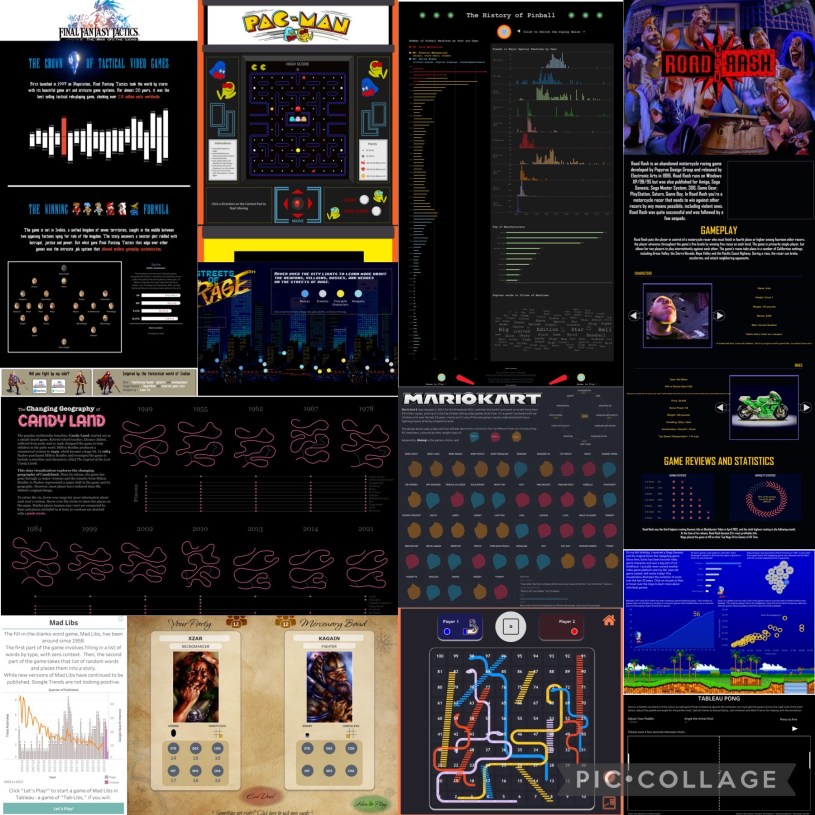
In July 2022, #IronQuest teamed up with Will Sutton, Tina Covelli and Louis Yu from the #GamesNightViz project to co-host the ‘Nostalgic Games’ round. For this round, we challenged participants to take a trip down memory lane and visualise data relating to take a trip down memory lane to visualise data relating to the games they used to play in their childhood. Whether that be video games, board games, card games or even school playground games, we were excited to see what people came up with for this challenge!
We received 12 submissions for this round and welcomed two first-time participants to the project. As always, it was fantastic to see the diverse range of topics covered and the creativity shown throughout the entries. Some authors chose to focus on a single board game or computer game and recap its history or components while others actually designed playable games in Tableau!
Feedback
The #GamesNightViz team and I provided feedback to everyone who requested it during our conversation, which has since been posted on YouTube. We had a lot of fun going through the entries, especially those where we got to play games!
You can listen to our feedback here:
We reviewed the vizzes in alphabetical order, by author’s first name. The video is split into chapters to make it easier for you to jump to vizzes of interest.
We covered vizzes by the following authors, reviewed in this order:
DataKo
Dennis Kao
Jason Knudson
Mo Wootten
Mohit Kumar
Satoshi Ganeko
Yash Shah
Now, let’s explore all of the entries!
THANK YOU to everyone who submitted entries for taking the time to create and share your work! Also, a big thank you to the #GamesNightViz team for being fantastic co-hosts.
All of the entries are posted below in alphabetical order by author’s first name. If you tweeted your viz or thought you submitted one via the Google Form but don’t see it here, let me know and I’ll work to include any additional entries ASAP.
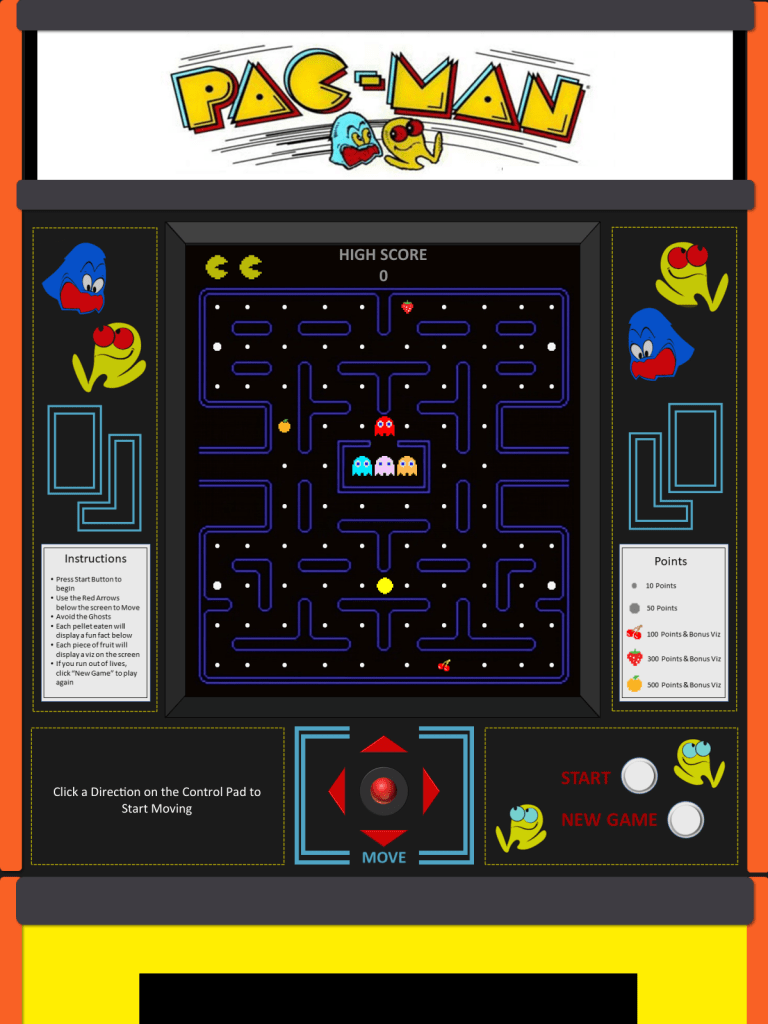
Brian Moore | Pac-Man Fun Facts
For this viz, Brian built a working Pac-Man game in Tableau!! That, in itself, is impressive but Brian didn’t stop there. When eaten, the edible pellets each display a fun fact about the game at the bottom of the viz, while the pieces of fruit (when eaten) will trigger a separate viz about Pac-Man facts to be shown on the screen. This is a fun way of incorporating data about the game into the game itself.
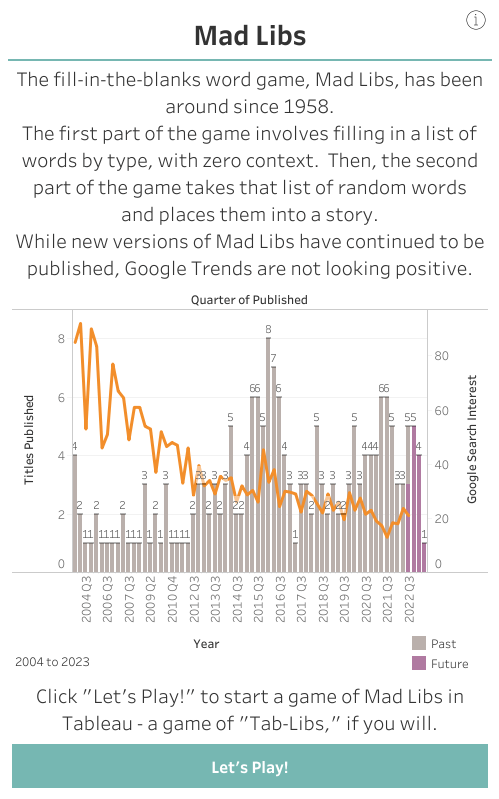
DataKo | Tab-Libs
For this viz, DataKo built a playable version of the ‘fill-in-the-blanks’ word game, Mad Libs. The viz shows some history of the games, including titles released and popularity from Google searches over time. Players can then play a version of the game, specially tailored to Tableau! We played this during the feedback call and had some hilarious results!
Dennis Kao | The Changing Geography of Candy Land
In this viz, Dennis mapped the geography of the board game, Candy Land. Dennis focused on how the game route, and the locations that appear along the way, have changed over the years. Hovering over the maps for each year displays a tooltip with more information on that particular release, as well as an image of the game board. His analysis focuses on the locations that appear on the game board and how frequently they have appeared in the various versions over the years. I love the innovative approach Dennis took with the maps in this viz! The result is a nice, visually compelling piece.

Jason Knudson | Evolution of Sonic The Hedgehog
For this viz, Jason took us back to his 6th birthday when he received a Sega Genesis with the original Sonic The Hedgehog game! Jason used this opportunity to analyse how Sonic has evolved over the years, including the number of games released, games consoles it’s been made available on, and sales revenues. The viz design brings back fond memories of playing Sonic and collecting rings!

Louis Yu | The Nostalgia of Final Fantasy Tactics
In this viz, Louis focused on the game ‘Final Fantasy Tactics’, first launched in 1997 on Playstation. For almost 20 years, it was the best-selling tactical role-playing game! The viz shows how game sales volumes compare to the average time it takes to complete the game. Both have increased in recent years. In addition, Louis shares the ‘winning formula’, with details on how to unlock different jobs and progress through the game! I really like the interactivity in the lower section.

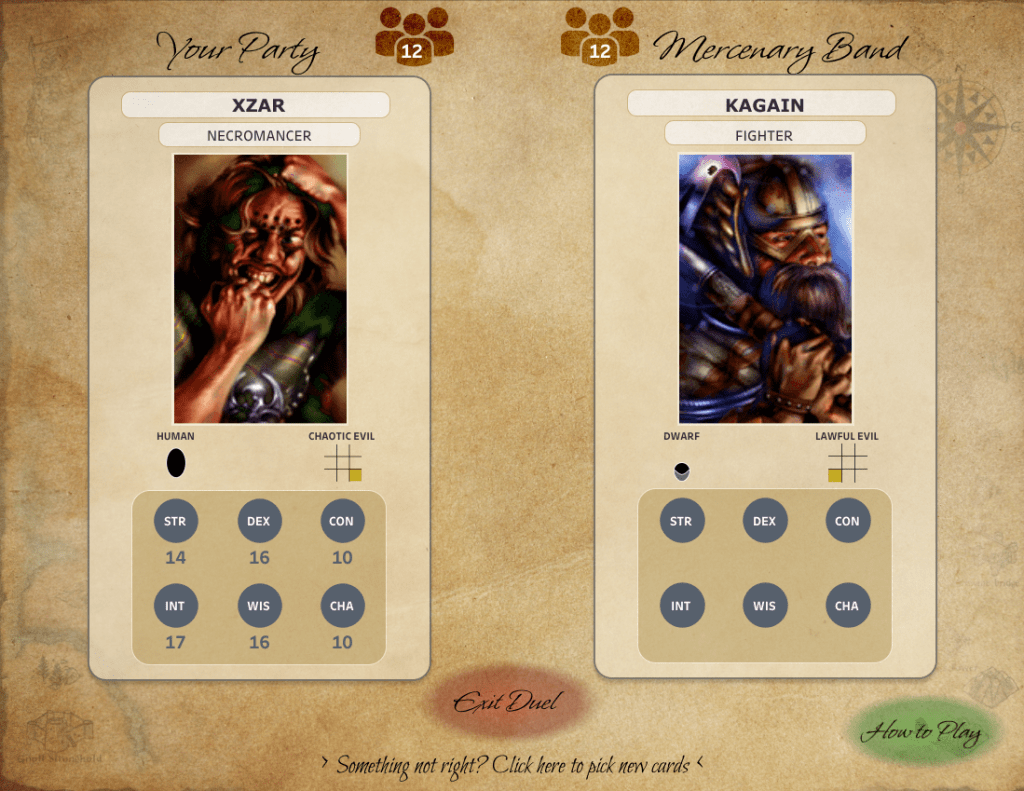
Mo Wootten | Baldur’s Gate Duel: Top Trumps
In this viz, Mo re-imaged the game ‘Baldur’s Gate’ as a Top Trumps-style duel, where game characters go head-to-head in an ability score battle! I had a lot of fun playing this game, despite being no expert in Baldur’s Gate! This viz/game is beautifully designed, with attention paid to every detail. It’s hard to believe it has been built in Tableau.
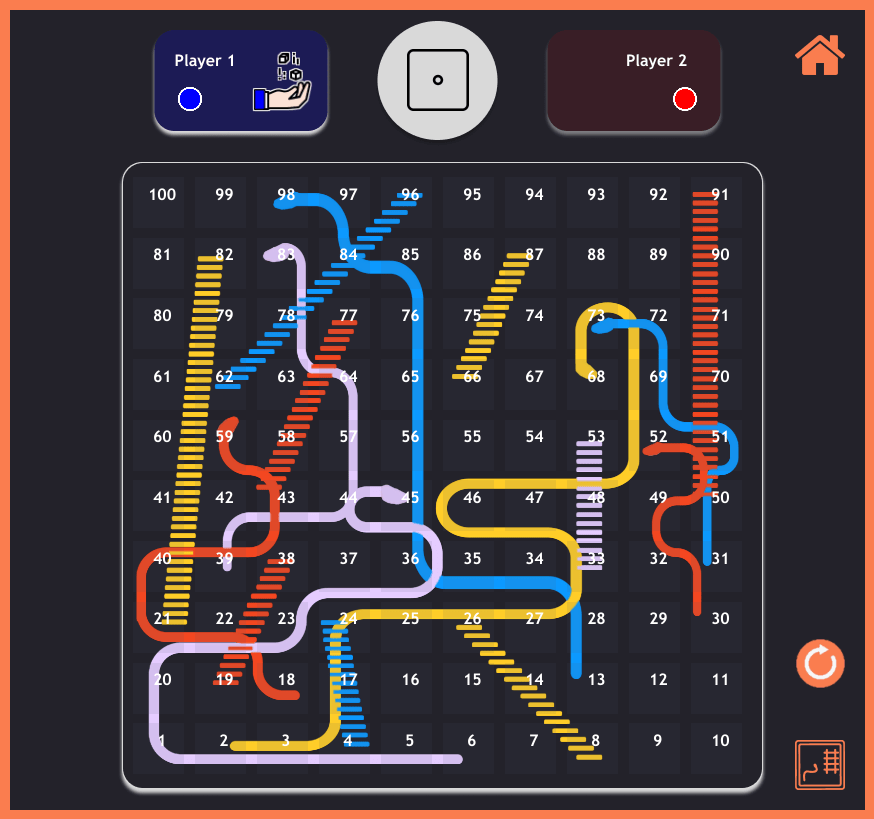
Mohit Kumar | Snakes & Ladders
For this viz, Mohit re-built the classic ‘Snakes & Ladders’ board game in Tableau! All the usual game rules apply; players can simply roll the dice and start moving their counter across the board. This viz is designed beautifully, with separate rules and instructions to guide users through the game.
Rob Radburn | MarioKart
For this viz, Rob visualised the 14 different features of the 45 characters in the popular Nintendo game, MarioKart. Rob used radar charts to represent each character, with colour used to show their weight class. I spent a lot of time looking at this viz. I’ll certainly reference it again before I play MarioKart next!

Satoshi Ganeko | The History of Pinball
In this viz, Satoshi visualised the history of pinball machines, taking us all the way back to 1931, when the first pinball machine was released. This viz includes two views; one that uses Sankey lines to connect the bar chart on the left with an annotated commentary on the right and the second (shown below), which visualises trends that have appeared in pinball machines over the years. This viz is packed full of interesting facts and what’s more, it’s even designed to look like a pinball machine!

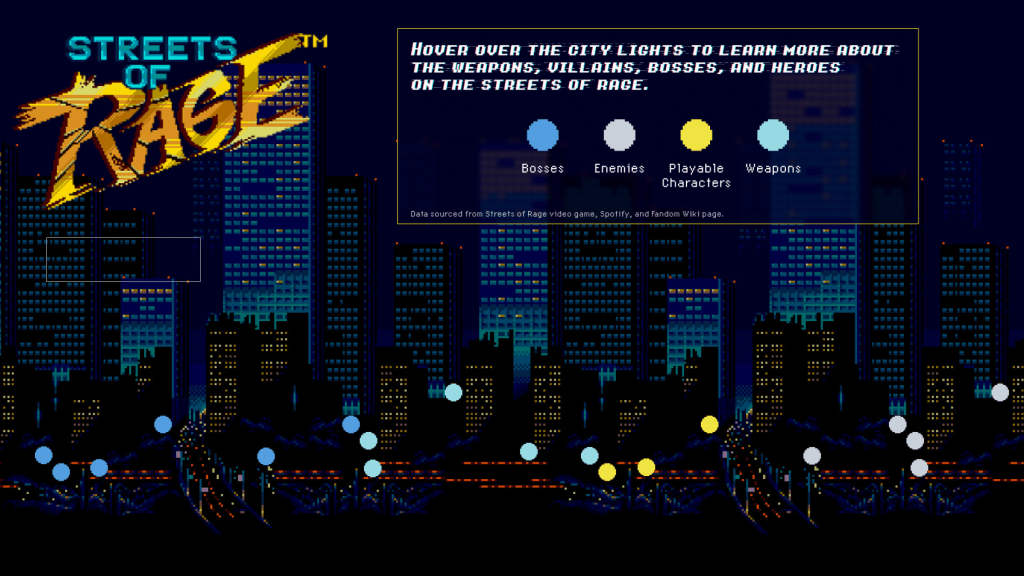
Tina Covelli | Streets of Rage
In this viz, Tina re-imagined the game, ‘Streets of Rage’, first released in 1991, in Tableau. Tina used the game background to reveal details about the game, including bosses, enemies, playable characters and weapons. Hovering over the city lights reveals a clever tooltip with additional details and imagery on each item. The viz even comes complete with music from the game for full effect!
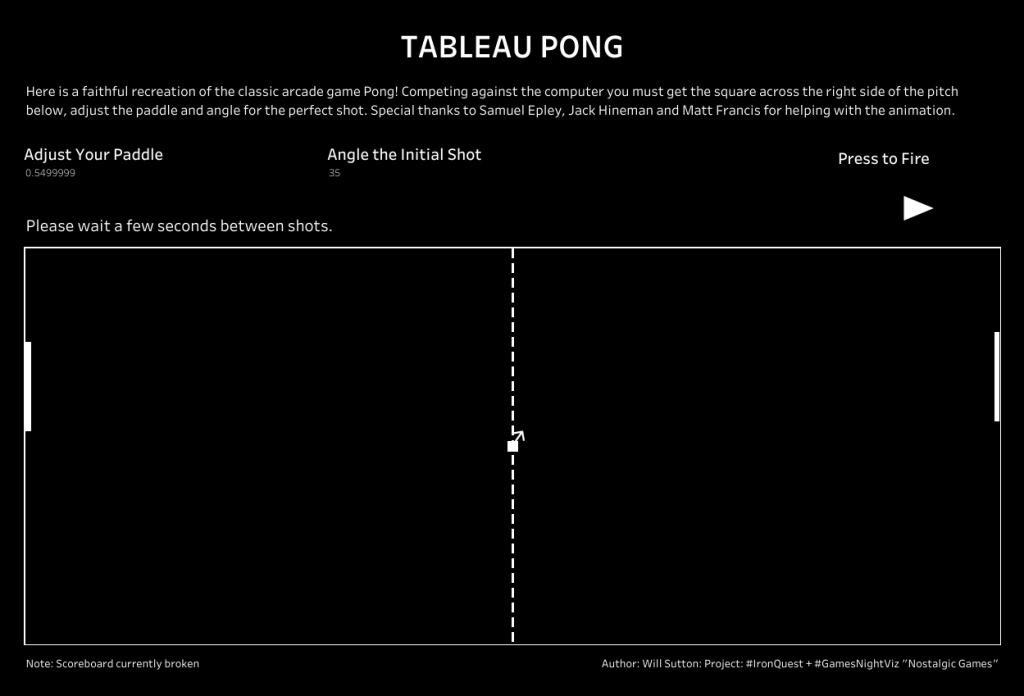
Will Sutton | Tableau Pong
In this viz, Will re-imaged the classic arcade game, Pong, in Tableau! Pong was one of the first computer games ever created. This simple ‘tennis-like’ game features two paddles on either side of the screen and a ball (square) in the middle. In this version, users can adjust the placement of the paddle and angle of the initial shot. I love the animation Will used in this viz. Check it out for yourself in Tableau Public!
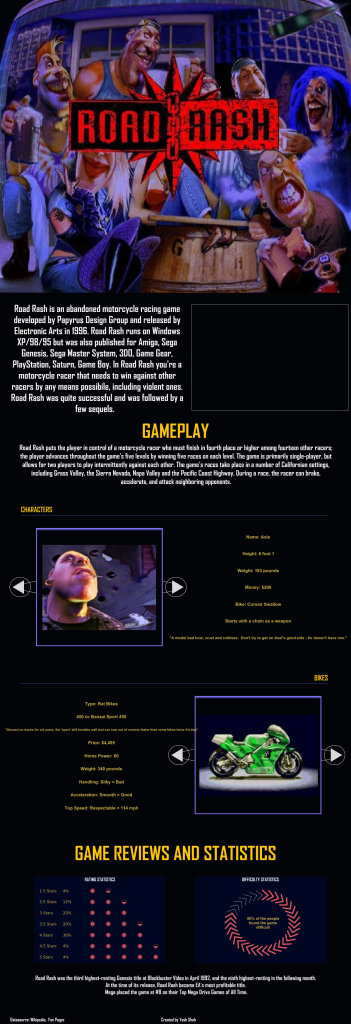
Yash Shah | Road Rash – Nostalgia Incarcerated
In this viz, Yash explored the motorcycle racing game, Road Rash, released in 1996. In the game, players can select different characters and bike models, all of which are included in Yash’s viz. Yash also included some data on game reviews and stats that show the popularity of the game at its peak in the 1990s. I love how the difficulty rating chart looks like a bike wheel!
We will be launching a brand-new #IronQuest project in September! Stay tuned for more information, to be shared soon!
In the meantime, stay up to date with all things #IronQuest by following the hashtag #IronQuest on Twitter and LinkedIn. Check out the Iron Quest section of my blog for details of the latest projects and how to participate.
Thanks for reading.
